“Don’t bet against LA,” was the message from Port of Los Angeles Executive Director Gene Seroka following the steep decline in imports, according to the AJOT. A softening in consumer demand, a loss of cargo to East and Gulf coast ports, and the stalled dockworker contract negotiations between the International Longshore and Warehouse Union (ILWU) and the Pacific Maritime Association (PMA) have resulted in January’s import volume dropping by 22% y/y. This time a year ago, just over 100 large container vessels were waiting to unload; a year later, that number has dwindled to zero, according to The Marine Exchange. The Port of Long Beach is also taking a long-term optimistic approach following a 26% y/y decrease in imports. Executive Director Mario Cordero says, “We are taking aggressive steps to meet a new set of challenges for the new year” and “remain optimistic that we will recapture market share.”
After briefly taking over the number one port in the country for imports for a few months last year, New York (18% market share) dropped back to second place behind Los Angeles (22%), slightly ahead of Long Beach (14%), Savannah (10%) and Houston (8%) rounding out the Top 5 import ports. Even though national import volumes increased by just over 5% m/m in January, total import volumes are down 17% y/y, according to IHS Markit. Furniture remains the number commodity imported in containers at 12% market share, although the total volume has declined 31% since last year. In the Top 20 imported categories, refrigeration equipment and cooking, ironing, and heating appliances reported the most significant declines, down 43% y/y. Imported sheets, towels, and blankets have decreased by 23% y/y, while toys have dropped 36% y/y. In contrast, auto parts reported a slight gain increasing by 4% y/y.
Market Watch
All rates cited below exclude fuel surcharges unless otherwise noted.
Capacity tightened again last week in the Southeast Region – load posts were up for the fourth week while spot rates increased by another penny-per-mile to $1.76/mile for all outbound loads. Most of the volume gains came from Atlanta and Charlotte markets, reporting a 6% w/w increase pushing average spot rates by $0.02/mile to $1.71/mile. Atlanta, the largest spot market in the region, reported a 4% w/w increase in volume and a $0.01/mile increase in outbound spot rates to $1.69/mile. Truckload capacity on the high-volume lane from Atlanta to Elizabeth, NJ, went against the market trend, with rates dropping to $1.52/mile, a new 12-month low. Loads south to Lakeland were also at a 12-month low of $2.73/mile.
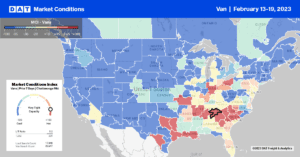
Dry van capacity continued to tighten in New Orleans ahead of Mardi Gras this week. Louisiana inbound rates were up $0.03/mile to $1.88/mile last week, while outbound rates were up $0.09/mile to $1.78/mile. Spot rates for 500-mile loads west to Dallas were the highest since September at $1.87/mile. Last week’s outbound average spot rate on the West Coast in California was identical to 2018 at $1.88/mile, mainly driven by softening Los Angeles and Ontario markets. Volumes in both markets are down 24% m/m, with rates down for the fourth week to $1.68/mile following last week’s $0.04/mile decrease.
Load-to-Truck Ratio (LTR)
This time last year, dry van load posts were almost triple the previous week’s volume following a less than one percent w/w decrease. Compared to the 2018 level, last week’s dry van volume was practically identical, but with 11% more carriers posting their trucks in search of loads last week, the dry van load-to-truck ratio (LTR) increased slightly last week from 2.37 to 2.48.
Linehaul Spot Rates
Dry van linehaul rates were tracking with typical first-quarter seasonal trends last week, although they were about $0.20/mile higher than in 2018. Following last week’s penny-per-mile decrease, the national average dry van rate of $1.75/mile is $0.91/mile lower than the previous year, and $0.22/mile lower than the top 50 dry van lanes based on the volume of loads moved, which averaged $1.97/mile last week.


