The shipments component of the Cass Freight Index increased by 7.3% m/m in February, impacted by weather impacts on freight markets and a Leap Day, the main factor behind the 2.0% m/m increase in seasonally adjusted (SA) terms. Compared to last year, the index was 4.5% lower, and the smallest decline in ten months, according to Tim Denoyer from ACT Research.
Get the clearest, most accurate view of the truckload marketplace with data from DAT iQ.
Tune into DAT iQ Live, live on YouTube or LinkedIn, 10am ET every Tuesday.
Denoyer noted, “February brought more encouraging signs that a freight recovery is beginning. Shipment volumes were slightly ahead of m/m seasonal expectations, and while they remained lower than last year, the gap continues to close. With normal seasonality, shipments will be down just -1% y/y in March and turn positive y/y in May. It’s been over two years since the first y/y decline of this freight recession, and with destocking playing out and goods consumption rising, we see this improvement as an encouraging sign that a recovery is beginning.”
Market watch
All rates cited below exclude fuel surcharges unless otherwise noted.
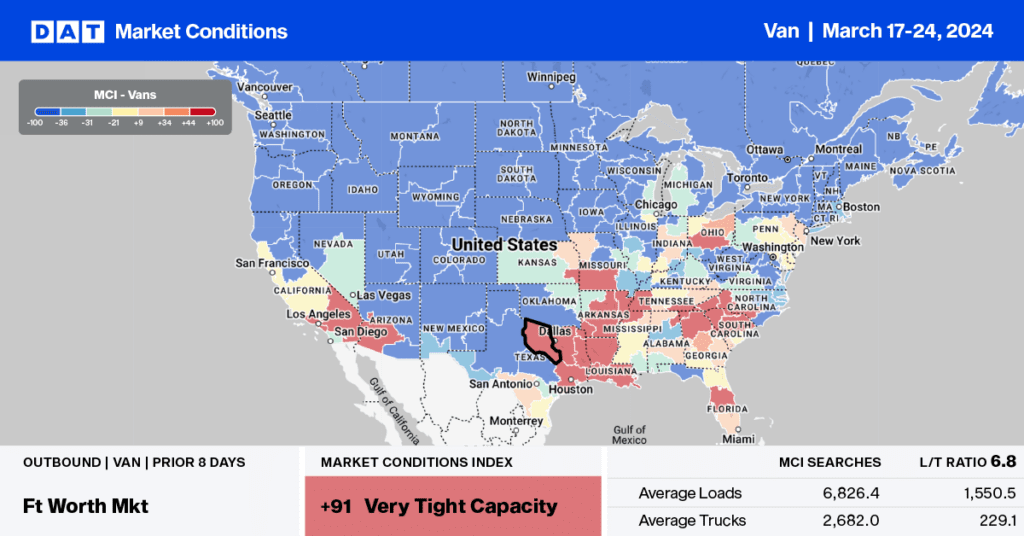
Even though the volume of outbound loads in Texas decreased by 5% last week, linehaul rates increased by $0.04/mile to a state average of $1.56/mile, making it the fifth week of successive gains. The Dallas/Ft Worth metroplex reported solid gains, with spot rates up 2% week-over-week (w/w) to $1.43/mile. Laredo, the largest commercial truck crossing zone for loads from Mexico, reported a 6% w/w decrease in loads moved while available capacity tightened with spot rates increasing by $0.05/mile to $1.78/mile.
In California, state average rates increased by $0.04/mile to $1.86/mile for outbound loads. Linehaul rates in the state have risen for the past four weeks and are now 8% higher than last year. On the high-volume lane east to Phoenix, Los Angeles dry van carriers were paid an average of $2.55/mile following last week’s $0.05/mile increase on an 11% lower volume of loads moved.
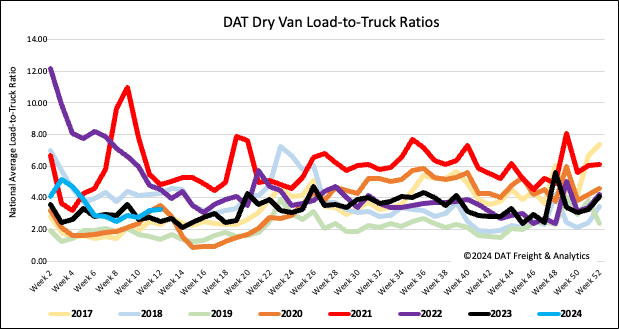
Load-to-Truck Ratio
Dry van load post volume decreased by 2% last week but was up 15% month-over-month (m/m) and 3% year-over-year (y/y). Available capacity decreased following last week’s 4% drop in equipment posts, increasing the load-to-truck ratio by 2% to 3.28.
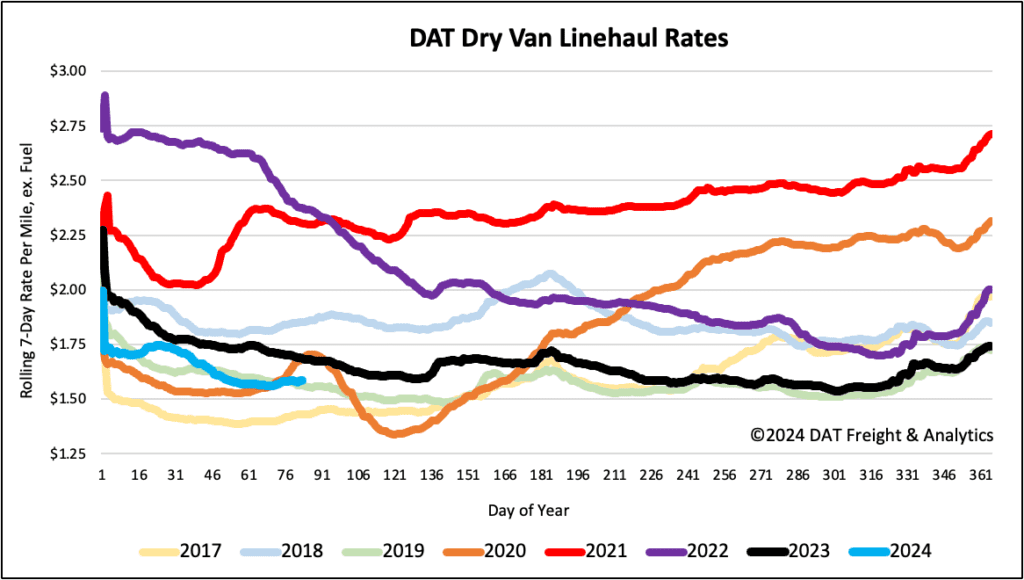
Linehaul spot rates
After being flat for the past month, dry van linehaul rates increased by $0.01/mile, the first weekly gain since mid-January’s national freeze. At $1.59/mile, dry van linehaul rates are $0.10/mile lower than last year. Based on the volume of loads moved DAT’s Top 50 lanes averaged $1.87/mile last week, maintaining the $0.28/mile spread above the national average.