The Logistics Managers’ Index , which provides insights into the logistics industry by surveying over 100 professionals, came in at 59.7 in August, down from July’s reading of 60.7. This is the first reading below 60.0 since May 2020 and the third consecutive reading below the all-time average of 65.3. This month’s reading still represents expansion; however, the index is 16.5 points down from March and is the most significant decline seen in five months. On the other hand, it is equivalent in scale to the rapid increase in the index experienced in the COVID recovery.
The transportation capacity index is seeing its fifth consecutive month of growth at 64.3; however, the warehousing capacity has contracted for the 24th straight month at 42.3. Inventory Levels continue to grow at a slightly reduced rate (-1.3) of 67.6. The index is down significantly from the all-time high growth rate of 80.2 observed in February but still well above the all-time average of 62.9 for this metric. The inventory costs index value continues its downward trend at 76.8, a 2.2 decrease from July and down 14.2 points from March’s all-time high reading of 91.0. The Transportation Prices Index registered 48.0 percent in August 2022. This corresponds to a drop of 1.5% from the July reading and continues to indicate contraction. As a result, we are seeing spot rates approaching levels close to 2018 vs. the sky-high rates of 2021, and this also releases pricing pressure on contract rates for the shippers.
JOC’s Ari Ashe recently reported some shipper perspectives on contract rates. “Some carriers are proactively coming back and saying, ‘Can I give you a rate reduction.’ So as we’re coming into the peak season, saying, ‘Yes we’ve got your price. But if you want a larger piece of this pie how about you reduce your rate?’ We’re using that as an opportunity.” Another shipper stated, “In late 2020 and 2021, we did anything we could to get product moved and we paid huge premiums for pop-up trucks. Three-quarters of that freight was miscellaneous stuff – not contract and not spot. But miscellaneous stuff is all but dried up this year. So now carriers are asking ‘how can we get more normal contracted volume?’”

All rates cited below exclude fuel surcharges unless otherwise noted.
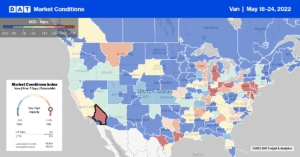
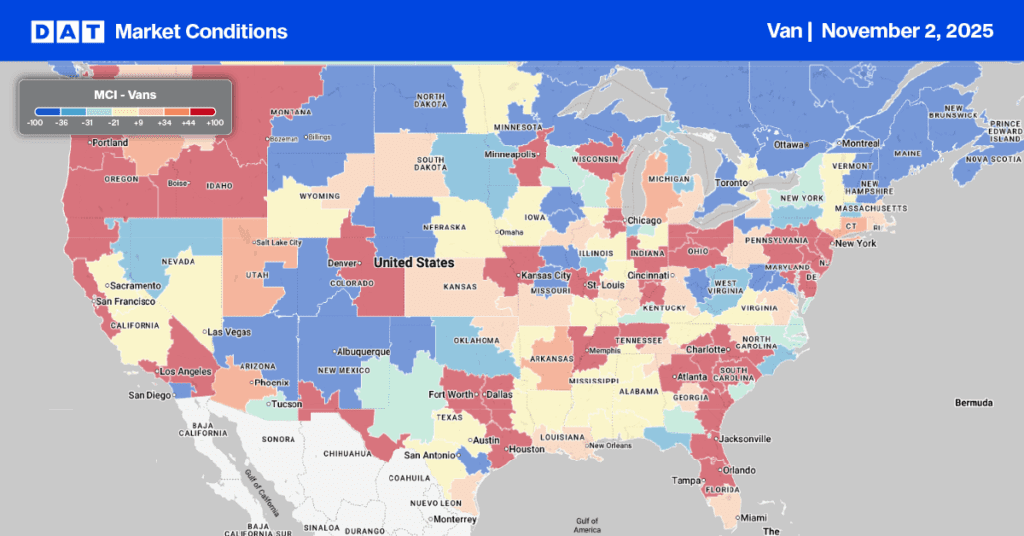
Dry van capacity was very tight in the Northeast Region last week, where outbound spot rates jumped by $0.13/mile to an average of $1.92/mile. Springfield, MA, one of the region’s primary manufacturing centers, was the only market to post higher weekly load posts. Loads 600 miles west to Cleveland, OH, were paying $1.55/mile, up $0.12/mile over the last three months but still $0.22/mile lower than the previous year. Even though it’s a small freight market, spot rates spiked in Charleston, WV, last week after linehaul rates increased by $0.54/mile to an average outbound rate of $2.58/mile. Short-haul loads 362 miles east to Baltimore were up just over $0.20/mile last week to an average of $4.22/mile, the highest since May but still around $0.40/mile lower than the previous year.
Linehaul rates out of the Pacific Northwest increased by $0.03/mile last week to an average of $1.32/mile, while in the large Seattle market, load posts were up by 3% w/w pushing up spot rates by $0.02/mile to $1.37/mile. Linehaul rates were not so good for carriers on the Seattle to Ontario, CA, the long-haul lane where rates at $0.54/mile are almost half what they were compared to the previous year. Rates in the opposite direction have also decreased by $1.43/mile since the start of the year to an average of $2.65/mile last week. Farther south in San Diego, spot rates increased by $0.09/mile to $2.19/mile the previous week, even though load posts dropped by 34% w/w. In Los Angeles, linehaul rates fell for the third week to $2.11/mile following last week’s $0.04/mile decrease and at $1.74/mile are around $1.00/mile lower than the previous year on the Los Angeles to Chicago lane.

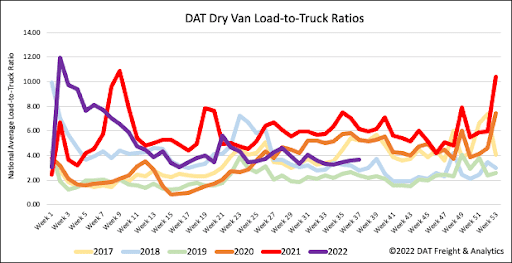
A short work week to mark the end of summer vacations and back-to-school saw volumes down just under 7% last week to start September 33% below last year. More carriers predictably took time off last week compared to prior years following a 9% w/w decrease in equipment posts, which are still at their higher level since 2019 for the start of September. Fewer load and equipment posts resulted in the dry van load-to-truck (LTR) increasing slightly from 3.57 to 3.64 last week.

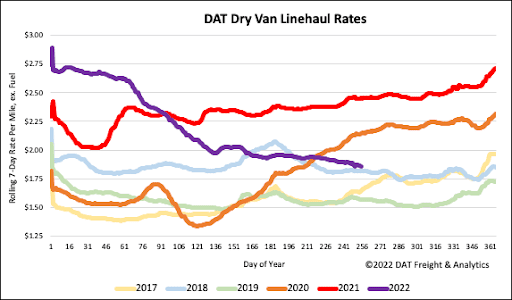
Dry van linehaul rates have decreased by 32% since the start to the year following last week’s $0.03/mile decrease. The national average dry van linehaul rate ended last week at $1.88/mile, which is $0.60/mile lower y/y and just $0.04/mile higher than in 2018. Dry van linehaul rates are still $0.24/mile higher than the average of pre-pandemic years at the start of September.


