Shippers in the U.S. saved more than 30% on intermodal contracts in the third quarter, according to the latest JOC Intermodal Savings Index (ISI). “Still, sagging truck rates have created intense competition on the spot market and caused shorter hauls to shift to the highways,” according to Ari Ashe, Senior Editor at the Journal of Commerce (JOC). The ISI is an excellent barometer for measuring shippers’ likelihood to use rail (intermodal) over road to move freight. The JOC indexes measure how much money a shipper should save on 117 modally competitive U.S. lanes, with a savings of 10% being the minimum benchmark for many intermodal shippers. Less than 10% saving translates into savings of less than $200 in many lanes and less than $150 per container on shorter haul lanes. Such a discount can be easily wiped out if the intermodal shipper incurs detention (excessive per diem) or demurrage (storage) fees or faces compliance fines for late deliveries.
The JOC Contract ISI averaged 130.9 in the third quarter (a saving of 30.9% for shippers), down from 138.3 in the same period a year ago and 131.9 in the second quarter. Spot intermodal rates dipped below 110 — or a 10 percent savings — early in the third quarter before recovering late in the quarter. The JOC Spot ISI averaged 112.3 (a saving of 12.3% for shippers) in the third quarter, down from 116.9 in the same period a year ago but up from 111.6 in the second quarter.
The contract-to-spot saving analysis shows that it only makes sense on a small number of lanes; last quarter, JOC found it only made sense on 21 out of 117 lanes to consider the conversion from intermodal to truckload spot, and now that total has dwindled to 16 lanes in Q3. According to Ari Ashe, most of these lanes have been truck competitive for years, such as Atlanta to Philadelphia and Orlando, Charlotte to Miami, Chicago to Dallas, or Chicago to Denver. Of course, the prospect of a rial strike may change all of this, but for the time being, long-haul intermodal shippers are in the driving seat.
Market Watch
All rates cited below exclude fuel surcharges unless otherwise noted.
Truckload volumes on the long-haul lane between Los Angeles and Chicago, a freight lane trucking competes heavily with intermodal on, have been flat for the last month. Los Angeles outbound dry van linehaul rates to all destinations have also taken a hammering, having dropped continually for the previous four weeks from $1.94/mile to $1.78/mile. On the high-volume Los Angeles to Chicago lane, linehaul rates at $1.62/mile last week were $1.39/mile lower y/y. This time last year, volume and rate trends were the reverse. Slowing import volumes and improving port congestion have a lot to do with truckload capacity loosening in California; imports into Los Angeles and Long Beach were down 12% and 16% m/m, respectively, and this week, the number of container ships at anchor waiting to be unloaded numbered just four. There’s still a backup but compared to normal pre-COVID levels of zero to one vessel at anchor and 109 in January this year, things have improved.
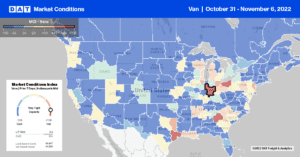
Dry van capacity tightened in Florida last week, reversing a 5-week slide throughout October. State-level rates increased by $0.04/mile to $1.16/mile, with most of the gains coming from the Tallahassee market, where spot rates increased by $0.08/mile to $1.45/mile. In the larger Miami dry van market, linehaul rates increased a penny-per-mile to just $0.89/mile. In the Pacific Northwest, outbound spot rates in Washington and Oregon have been trending up in the prior three months but, at $1.42/mile, are almost identical to 2016.
On the 2,000-mile haul east to Chicago out of Seattle, spot rates were flat last week at $1.05/mile, just over $1.00/mile lower than the previous year. In the Pendleton, OR, market, dry van capacity tightened last week, with rates rising by $0.18/mile to $1.33/mile. Loads east to Des Moines, IA, increased by $0.10/mile last week to $1.40/mile.
Load-to-Truck Ratio (LTR)
Even though volumes are down 18% m/m, dry van spot market volumes increased for the second week, following another 3% w/w gain. Volumes are 41% lower y/y to the start of November and, compared to earlier years, are 49% higher than in 2018 and just 10% higher than in 2017. The number of carriers posting their equipment in search of loads was flat last week but remained 10% higher than in 2019 when the market was oversupplied with trucks. Slightly higher load and equipment posts pushed the dry van load-to-truck ratio (LTR) up to 2.71 last week.
Linehaul Spot Rates
Dry van spot rates remained flat last week at a national average of $1.75/mile, which is $0.77/mile lower y/y. The top 50 dry van lanes, based on the volume of loads moved, averaged $2.05/mile again last week, $0.30/mile higher than the national average. Compared to non-pandemic years before 2020, spot rates at the start of November averaged $0.13/mile, lower at $1.62/mile.


