Traffic congestion across the United States mounted significantly in 2025, according to INRIX, costing the national economy over $85 billion in lost time—an 11.3% increase from the previous year. The typical U.S. driver lost an average of 49 hours to traffic jams, up six hours from 2024, resulting in a personal cost of nearly $894 in lost productivity. This crippling inefficiency is heavily concentrated in major metropolitan areas, with Chicago taking the top spot nationally (112 hours lost, costing the average driver over $2,000), followed closely by New York City (102 hours lost, though topping the list with $9.7 billion in total city-wide congestion costs). Cities like Philadelphia and Baltimore saw the largest increases in delay, climbing 31% over the previous year and cementing the fact that congestion remains a top economic threat.
Tune into DAT iQ Live, live on YouTube or LinkedIn, 10am ET every Tuesday.
The most severe delays are concentrated on specific, recurring corridors that serve as economic arteries. The single busiest corridor in the U.S. for 2025 was a stretch of I-95 Southbound in Stamford, Connecticut, where drivers lost an astounding 133 hours during the 8:00 AM peak commute hour alone, with the corresponding northbound segment placing second at 94 hours lost. Other top-ranked chokepoints included the Brooklyn-Queens Expressway (I-278 WB) in New York City (93 hours lost), I-4 Eastbound in Orlando (91 hours lost), and I-680 Eastbound in the San Francisco Bay Area (90 hours lost). The data shows that the majority of these bottlenecks occur during the afternoon (4:00 PM to 5:00 PM) and morning (7:00 AM to 8:00 AM) rush periods, demonstrating predictable failures in the nation’s outdated highway infrastructure.
The financial and human toll of these traffic failures is immense. Across the country, the collective 4.7 billion hours lost to traffic congestion is equivalent to sacrificing approximately 2.2 million full-time jobs worth of productivity annually. For policymakers and transportation planners, the 2025 scorecard underscores the failure to keep pace with vehicular demand and highlights the urgent need for investment—whether through road expansion, smarter traffic management, or expanded public transit options—to mitigate the escalating economic drag caused by traffic. Without strategic intervention, this lost time and rising cost will continue to erode the competitiveness of America’s largest urban centers.
All rates cited below exclude fuel surcharges, and load volume refers to loads moved unless otherwise noted. The rate charts exclude 2021 and 2022, years influenced by the pandemic.
Dry van load post volumes saw a significant week-over-week increase of 16% during the first five-day shipping week of the year (compared to Week 2 of the previous year). This surge in volume, totaling just over 1.5 million load posts, drove the national load-to-truck ratio up by 40% to 10.57.
This volume is 67% higher than the 10-year average for Week 2 (excluding the pandemic-influenced years of 2021 and 2022), suggesting that freight brokers are encountering a shortage of available dry van capacity in most freight markets. Supporting this, only eight of the 135 freight markets tracked weekly across DAT’s network reported a decrease in load post volumes week-over-week.
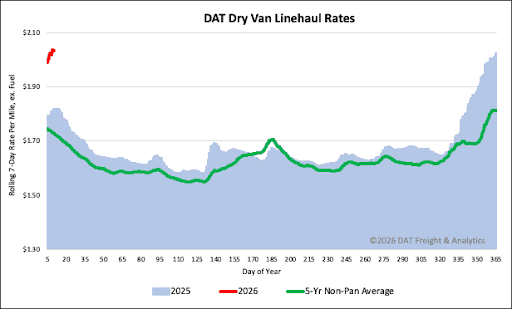
Dry van linehaul spot rates averaged $2.04 per mile last week, a $0.02 decrease after remaining flat the previous week. This rate represents a substantial year-over-year increase, sitting $0.22 (12%) higher than the same week last year. Furthermore, it is $0.31 per mile (15%) higher than the 5-year average, excluding the years influenced by the pandemic.
The average rate for DAT’s top 50 lanes by load volume decreased by $0.03 per mile last week, averaging $2.40 per mile and $0.36 higher than the national 7-day rolling average spot rate.
In the 13 key Midwest states, which represent around 45% of national load volume and often indicate future national trends, spot rates decreased by $0.04 per mile to $2.48 per mile, which was $0.44 above the national 7-day rolling average.