By Christina Ellington, DAT iQ
As ports see increased congestion ahead of the peak shipping season, supply chain delays are at the forefront of discussions. According to a WSJ article, container ships waiting outside the East Coast’s busy New York-New Jersey port last week reached an average of 14 vessels a day, the highest since the Covid-19 pandemic began.
Will the shift of imports from the west coast to the gulf and east coasts cause a whole new set of challenges for this year’s peak season, and will the challenges of 2021 repeat themselves? According to PIERS data, U.S. imports from Asia declined 3.7% to the West Coast while jumping 9.6% to the East Coast and 35.4% to the Gulf Coast compared with the same period in 2021. Gene Seroka, the Los Angelos port’s executive director, is optimistic about the industry’s ability to quickly divert vessels from other trade lanes mentioned in a recent article from the JOC.
Asian imports through April increased 12.8% in New York-New Jersey, 8.8% in Savannah, 11.4% in Norfolk, 38.2%in Charleston, and 46.3% in Houston y/y. Asian imports through April declined 3.9% in Los Angeles–Long Beach, 7.2% in the Northwest Seaport Alliance of Seattle and Tacoma, and 7.7% in Oakland. Will the dry van spot rates start to increase and demand shift back to the west coast in peak season is top of mind for carriers and shippers alike.
The recent declines in spot rates could also cause another shift in the supply chain and trucking industry. A recent article from the JOC found that independent drivers working at the Port of Savannah for the high dray rates are now reaching back to their large-fleet ex-employers seeking work amid the recent decline in spot rates. Jeff Banton, president of the drayage provider Atlantic Intermodal Services, said some drivers have returned, and more are likely to return over the next two months. Could this trend spill over to the trucking industry at large, or will the signals of pending import increases keep the independent drivers holding on?
All rates cited below exclude fuel surcharges unless otherwise noted.
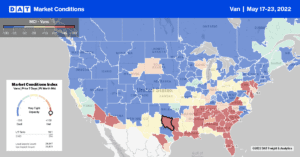
Dry van available capacity was noticeably tight in the Southeast region last week, where produce season is underway. Linehaul spot rates increased for the fourth week in a row following last week’s $0.08/mile increase to a regional average of $2.08/mile. Jacksonville recorded the most significant w/w increase, with rates increasing by $0.15/mile to $2.05/mile for outbound loads. Capacity was also tight in the port market of Charleston, where dry van spot rates jumped $0.17/mile to an outbound average of $2.64/mile last week. Loads heading 320-miles west to Atlanta were down slightly last week to an average of $2.81/mile, which is $0.13/mile lower than the previous year.
On the West Coast, where produce season is beginning to ramp up after a prolonged start, dry van capacity tightened as spot rates increased by $0.02/mile to $2.13/mile in Los Angeles after decreasing for the three weeks prior. Outbound spot rates in nearby Ontario also increased by $0.02/mile to $2.26/mile last week. On the Los Angeles to Chicago lane, where truckload competes with intermodal. Spot rates continue to slide. At $1.67/mile, dry van spot rates are now $0.74/mile lower than the previous year and 49% lower than the peak of $3.29/mile in December.
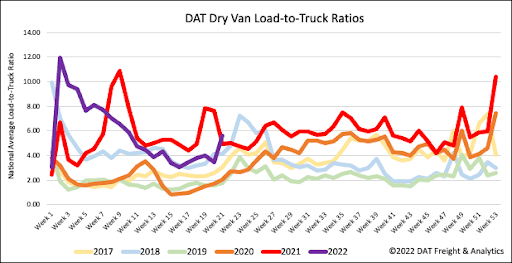
As is the case most years when International Roadcheck Week occurs, the 72-hour safety blitz results in many carriers taking the week off. Last week was no exception as dry van equipment posts plummeted 16% w/w, more than double the average decrease observed during the five previous Roadcheck Weeks. Load post volumes surged as capacity tightened, increasing by 36% w/w. As a result, the dry van load-to-truck ratio almost doubled from 3.44 to 5.60.
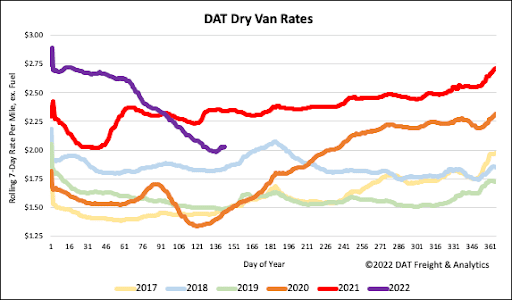
After dropping $0.74 since the start of the year, dry van linehaul spot rates (excluding fuel) reversed course last week, increasing by $0.04/mile. This isn’t unusual during Roadcheck Week, so it is not a given this trend will reverse the long-term market correction. The national average dry van linehaul rate ended last week at $2.04/mile excl. FSC is $0.31/mile lower than the previous year and $0.20/mile higher than the same week in 2018.


