The March reading of The Cass Freight Index shipments component fell 1.0% m/m in March as freight markets continue to work through an extended soft patch. “Mild weather this winter and Omicron a year ago supported volume comparisons in January and February, so the lower result in March was unsurprising. Soft real retail sales trends and ongoing destocking remain the primary headwinds to freight volumes, and sharp import declines suggest this type of environment will persist for some time,” according to ACT Research Vice President Tim Denoyer.
The shipments index was 1.0% lower m/m in March, and compared to the same period last year, the index was 4% lower and 3.4% lower compared to 2021. Data within the Index includes all domestic freight modes and is derived from 36 million invoices and $44 billion in spend processed by Cass annually on behalf of its client base of hundreds of large shippers. These companies represent a broad sampling of industries, including consumer packaged goods, food, automotive, chemical, medical/pharma, OEM, retail, and heavy equipment.
Market Watch
All rates cited below exclude fuel surcharges unless otherwise noted
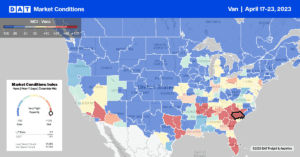
Dry van capacity tightened slightly last week in the Southeast, reversing a three-week slide in linehaul rates. Rates were up $0.03/mile to $1.30/mile for outbound regional loads to all markets. In Atlanta, the Southeast’s largest market, spot rates were up a penny-per-mile to $1.60/mile, which was $0.04/mile lower than in 2017 and 2019. High-volume lanes from Atlanta to Orlando and Miami at $2.27/mile and $1.95/mile were the lowest reported in 12 months.
In the Northeast, dry van capacity was much tighter in New Hampshire and Maine following last week’s $0.25/mile increase to a $2.16/mile outbound average. Further south in West Virginia, outbound spot rates at $2.08/mile are closer to 2018 levels, following last week’s $0.09/mile increase. In the Pacific Northwest in Washington State, spot rates increased by $0.03/mile to $1.35/mile, almost the same as in 2019. At $1.81/mile, California outbound average spot rates are identical to 2019, while rates in the combined Los Angeles and Ontario markets were flat at $1.60/mile on 10% higher w/w volumes. Los Angeles to Stockton loads, at $2.48/mile, are around $0.07/mile lower than the March average and the lowest in 12 months.
Load-to-Truck Ratio (LTR)
Volumes increased by 8% last week and continue higher by the same amount as in pre-pandemic years. Equipment posts are around 7% higher over the same timeframe, resulting in last week’s dry van load-to-truck ratio (LTR) increasing by 12% w/w from 1.82 to 2.04
Linehaul Spot Rates
Excluding the fuel surcharge, dry van linehaul rates have dropped by 18% this year, recording weekly decreases in fifteen of the sixteen weeks. Following last week’s $0.02/mile decrease, the national average dry van rate at $1.61/mile remains $0.09/mile above 2019 levels and $0.05/mile above the average for Week 16 in pre-pandemic years. Based on the volume of loads moved the average rate for the top 50 dry van lanes was $0.22/mile higher at $1.83/mile last week.


