According to CASS Information Systems, U.S. freight volumes slowed further in March, with the shipments component of the Cass Freight Index up just 0.6% y/y, slower than the 3.6% y/y growth in February. Shipments in March were up 2.7% m/m, but this is still 1.0% below the typical seasonal pattern as freight volumes were slowing even before the war in Ukraine began. Tim Denoyer, Vice President and Senior Analyst at Research, said, “Our outlook for the U.S. freight market, detailed in the ACT Freight Forecast report, seems to have swung from below consensus to above consensus in the past several weeks, as we think recession fears are overdone.”
In the contract freight market, rates are plateauing after multiple quarters of double-digit rate increases. To the surprise of many, new contract rates entering shippers routing guides have decreased 2% in the two weeks ending April 4 compared to the prior period, according to data tracked by DAT. The CASS Freight Index report also supports this view suggesting we’re at the peak of the rate cycle.
Denoyer noted, “the combination of inflation, Fed monetary tightening, the war in Europe, and substitution back to services from goods are shifting the freight cycle from the early stage to the late stage. The recovery in labor capacity is again a key feature. However, equipment production remains constrained, and marginal capacity entering the market by paying nearly new truck prices for three-year-old used trucks will have a high cost base and difficulty competing at lower spot rates. Supply shortages may still tighten the truckload sector, depending particularly on neon, and will continue to have a big impact on the direction of the U.S. freight cycle”.
In Los Angeles, load post volumes jumped 12% w/w as railroad capacity continues to be impacted by labor and chassis trailer shortages, especially further inland in land-locked Chicago intermodal terminals. As a result, loads moved by truckload carriers increased 2.5% w/w between Los Angeles and Chicago last week, although truckload capacity loosened on this lane where spot rates have dropped by 46% or $1.51/mile excl. FSC since December to $1.78/mile excl. FSC this week. Even though loads moved dropped 2% w/w between Los Angeles and Phoenix, capacity tightened, increasing spot rates by $0.26/mile to a 7-day average of $3.86/mile excl. FSC, which is around $0.05/mile lower than the previous year.
In the smaller East Coast Wilmington market, load post volumes increased by just over 4% w/w, resulting in spot rates increasing by the same amount to an outbound average of $2.33/mile excl. FSC this week. On the 940-mile west to Little Rock, spot rates inched higher by $0.03/mile to $2.51/mile excl. FSC or around $0.50/mile higher than the previous year. Further north in Brooklyn, NY, volumes jumped 19% w/w, resulting in spot rates increasing by $0.08/mile to an outbound average of $2.51/mile excl. FSC. On the 850-mile haul from Brooklyn to Atlanta, spot rates dropped by $0.34/mile to an average of $2.29/mile excl. FSC last week, although this is still $0.27/mile higher than the previous year. In the larger Elizabeth market nearby, capacity loosens even as load post volumes increase by 8% w/w. Outbound spot rates dropped for the fourth week in a row and are now under $2.00/mile at $1.94/mile excl. FSC. On the high-volume lane south to Atlanta, spot rates have plunged to $1.85/mile excl. FSC this week after dropping $0.68/mile from the March average. Spot rates on this 870-mile lane are now $0.28/mile lower y/y.
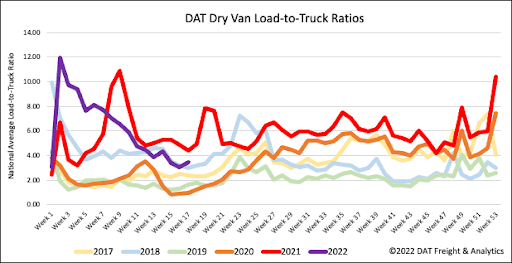
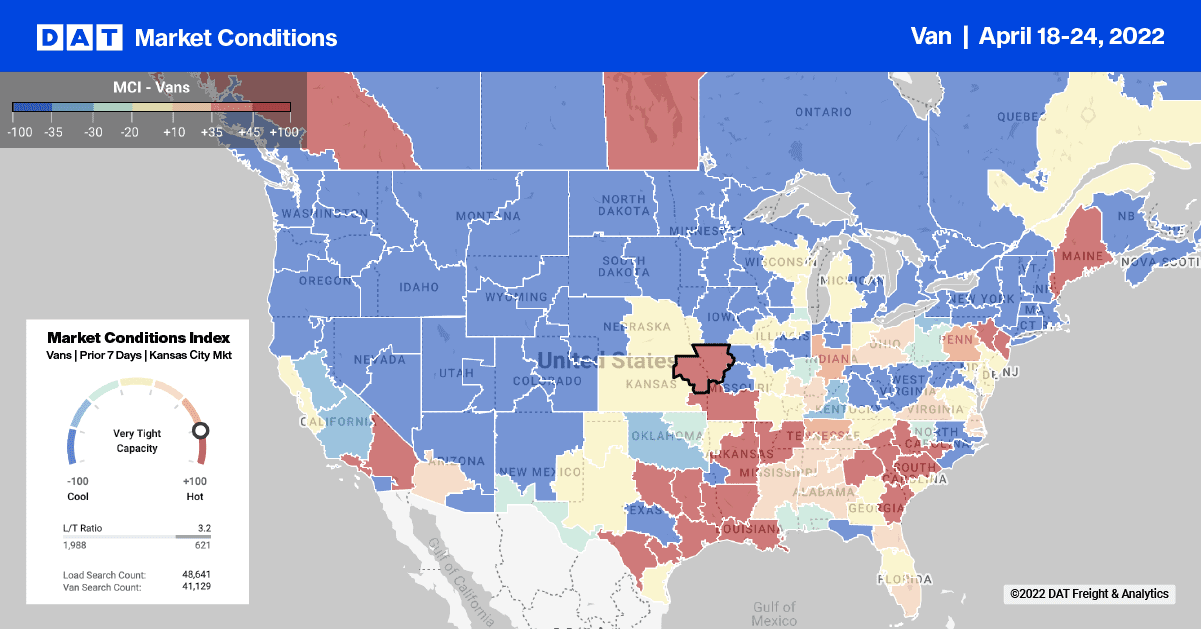
Dry van load post volumes are still around 2018, while equipment posts remain at 2019 levels as capacity loosens. Last week, load post volumes reversed course, increasing by 12% w/w after almost two months of declining weekly volumes. Equipment posts decreased slightly, resulting in last week’s dry van load-to-truck (LTR) ratio increasing 14% from 3.02 to 3.47.
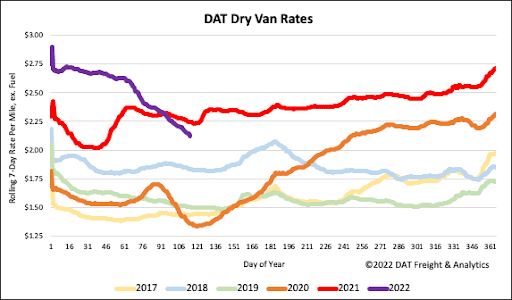
The slide continues as dry van spot rates dropped another $0.06/mile last week to a national average of $2.16/mile excl. FSC. That makes it fourteen straight weeks of declines, with spot rates now down $0.62/mile YTD and $0.12/mile lower than the previous year. Compared to non-pandemic years back to 2016, last week’s national average is still $0.62/mile higher than the average of $1.50/mile excl. FSC for this time of the year.


