The same week, U.S. Treasury Secretary Janet Yellen warned China that Washington would not accept new industries being decimated by Chinese imports. In March, import data showed that Chinese imports were 26% higher than last year. Nationally, containerized import volume, as measured in twenty-foot equivalent units (TEU), increased by 4% month-over-month (m/m) and 23% year-over-year (y/y). TEU volume from China accounted for just over a third of all March imports into the U.S. and almost half of the volume in the Ports of Long Beach and Los Angeles last month.
Get the clearest, most accurate view of the truckload marketplace with data from DAT iQ.
Tune into DAT iQ Live, live on YouTube or LinkedIn, 10am ET every Tuesday.
There was a slight shift in volume back to the East Coast in March, with volumes increasing by 6% m/m compared to West Coast volumes, which only increased by 1% m/m. East TEU volumes accounted for 45% of TEU volume in February compared to 46% last month, while West Coast volumes dropped from 44% to 42% of total volume in March. The shift back to the east was driven by solid gains in New York, where volumes increased by 13% m/m, while in the largest port for imports, the Port of Los Angeles, volumes dropped 7% m/m.
Market watch
All rates cited below exclude fuel surcharges unless otherwise noted.
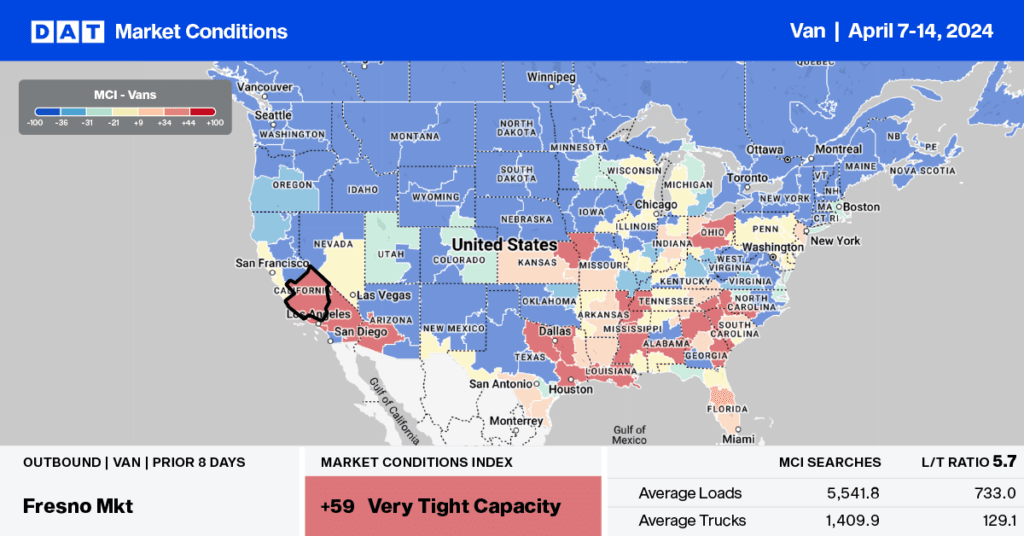
Available capacity has tightened in Los Angeles over the last month even though linehaul rates were mostly flat last week, averaging $1.65/mile. Outbound linehaul rates have increased by $0.07/mile in the last month on a 1% higher volume of loads moved. On the high-volume regional lane to Stockton, 340 miles to the north, carriers were paid an average of $2.63/mile last week, $0.14/mile higher than last year. A recipient of imports in the Ports of Los Angeles and Long Beach, linehaul rates on this lane are forecast to increase by another $0.33/mile to $2.96/mile by the end of June, in line with an expected increase in containerized import volume from Asia.
In DAT’s Top five spot markets (Los Angeles, Dallas, Chicago, Elizabeth, and Atlanta), linehaul dropped by a penny per mile to $1.52/mile on an 8% higher volume of loads moved. In the Elizabeth, NJ, market, outbound load volume is 32% higher year over year following last week’s 9% w/w increase. The 34% year-over-year increase in containerized import volume is driving a substantial truckload freight volume through New York and New Jersey ports.
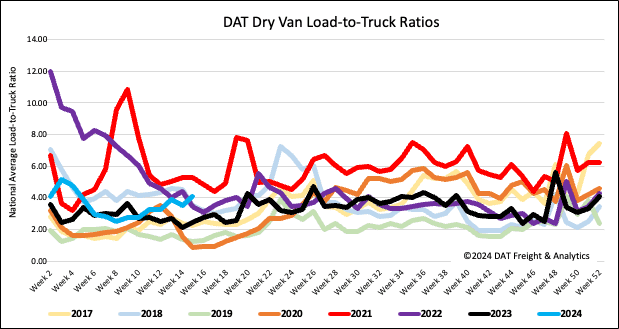
Load-to-Truck Ratio
Dry van load post volume regained the ground lost from the prior week, rising by 7% last week. However, volumes remained 2% higher month-over-month (m/m) and 10% higher year-over-year (y/y). Ongoing interstate carrier exits from the industry decreased available spot market capacity following last week’s 8% drop in equipment posts, increasing the load-to-truck ratio by 17% to 4.1.
Linehaul spot rates
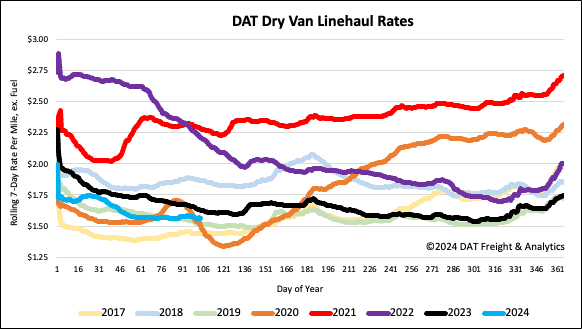
After mainly being flat for the last seven weeks, the national average dry van linehaul rate decreased by almost a penny per mile to just over $1.57/mile last week. Compared to last year, linehaul rates are $0.06/mile lower and just $0.05/mile higher than 2019.