By Christina Ellington
Import volumes are rising, and port congestion may not be far behind. The Freight Analysis Framework (FAF) indicates that approximately 5% of domestic truckload freight tonnage comes directly from Imports.
According to the latest data from PIERS, Imports for May are up 3% m/m and 6% y/y. For the CA ports of Long Beach and Los Angeles, May import volume is up 12% m/m and 3% y/y; Oakland’s import volume is up 18% m/m and 9% y/y, possibly signaling a volume uptick back to the west coast. A recent article by the JOC highlights that the west coast ports are concerned about the lack of rail containers. Long-dwelling rail containers are also the biggest obstacle to port fluidity in Southern California, but if Union Pacific Railroad and BNSF Railway would deploy more capacity to the ports, “We could clear out the rail containers in two weeks,” Gene Seroka, executive director of the Port of Los Angeles.
According to the JOC, the Port of Houston announced its two container terminals will be open to truckers for at least six months on Saturdays. Houston’s May imports were pretty flat at 0.6% m/m, but y/y increases are significant at 24%. Port Houston said an average of 45,000 trucks call the port on weekdays, conducting 65,000 container transactions. Infrastructure enhancements are also occurring at other high-volume ports. The US Department of Transportation awarded $6.2 million to upgrade part of the tracks that connect the port of Savannah to Georgia’s first inland port, part of the broader $368 million in grants the agency awarded as part of a nationwide railroad investment program. The Savannah port is the fourth-largest port in import volume, and May imports were down 3% m/m but up 7% y/y.
Father’s Day is also coming up this week, and according to the National Retail Federation NRF, Consumer spending is expected to total $20 billion, nearly on par with last year’s record-setting figure of $20.1 billion, according to the annual consumer survey. “Despite growing concerns about inflation, consumers plan to spend approximately the same amount as last year in celebration of Father’s Day,” NRF President and CEO Matthew Shay said. “Spending patterns also reflect the sentimental nature of the holiday as consumers are prioritizing unique and meaningful gifts.” The special outing (dining out) category has the highest expected spending this year at $32.29 per person, followed by the clothing category at $26.62 per person.
All rates cited below exclude fuel surcharges unless otherwise noted.
The volume of loads moving between Los Angeles and Chicago reflects the monthly import volumes recorded in the Ports of Los Angeles and Long Beach. Volumes have been steady the last few weeks but are up 23% y/y. As intermodal capacity and increasing dwell times increase, so are truckload spot rates, which are also trending up, averaging $1.84/mile this week after dropping by $1.45/mile since December. On the East Coast in Charleston, South Carolina, Ports achieved another record month for containers handled, marking the 15th consecutive month of cargo records at the Port of Charleston. Loaded imports were up 18% in May compared to last year, with truckload capacity still loose and outbound linehaul rates trending down, averaging $2.54/mile this week following a $0.10/mile decrease.
In Elizabeth, NJ, home to the second-largest port in the country and largest on the East Coast, import volumes were up 1% m/m and are now up 15% y/y. Truckload capacity has been flat for the last four weeks with outbound rates averaging $1.73/mile, while on high-volume lanes, including Atlanta, linehaul rates are trending down. At $1.52/mile this week, spot rates from Elizabeth to Atlanta are $0.52/mile lower than the previous year.
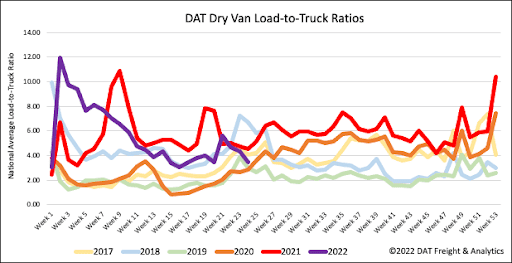
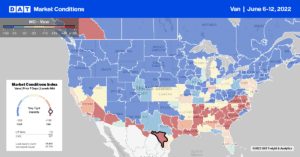
Dry van capacity loosened rapidly last week following a 22% w/w increase in carriers posting their equipment on DATs loadboard. Load post volumes were down 2% w/w and by the same amount over the last month resulting in the dry van load-to-truck (LTR) ratio dropping by 20% from 4.34 to 3.47 last week. At 3.47 loads per truck, we’re getting close to 2019 levels when the market was oversupplied.
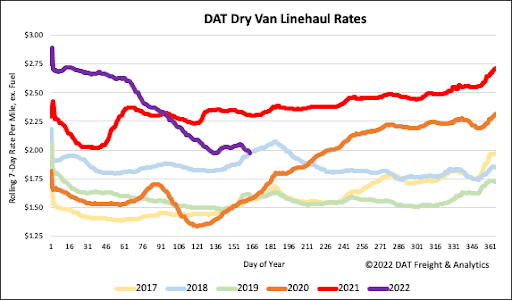
After remaining relatively flat for the last three weeks of May, dry van linehaul spot rates continued the downward trend of the prior five months. Spot rates dropped by $0.06/mile the previous week at a time when we’d typically expect them to be steadily climbing in the weeks ahead of the July 4 celebrations. In the first two weeks of June, average dry van spot rates usually increase by $0.08/mile, but that’s in pre-pandemic years. In the last two weeks, dry van linehaul spot rates have dropped $0.04/mile to an average of $2.00/mile. Last week’s national average was $0.33/mile lower than the previous year and the same as the equivalent week in 2018.


