A bitterly cold January most likely contributed to fewer housing starts breaking ground last month, with single-family homes, which account for around 75% of monthly construction, down 4.7% month-over-month (m/m). Multi-family homes recorded the sharpest decrease in January, falling 35.8% m/m. According to the Commerce Department’s Census Bureau, permits for future single-family construction, a leading indicator of flatbed demand, suggested a rebound in the coming months following a 13th straight month of gains. Single-family permits increased 1.6% m/m and are now 35.7% higher than last year.
Get the clearest, most accurate view of the truckload marketplace with data from DAT iQ.
Tune into DAT iQ Live, live on YouTube or LinkedIn, 10am ET every Tuesday.
Rising permit rates point to optimism for truckload carriers as builders look to the Federal Reserve to start cutting interest rates sometime in the first half of this year. According to the National Association of Home Builders (NAHB)/Wells Fargo Housing Market Index (HMI), “Builder confidence in the market for newly-built single-family homes climbed four points to 48 in February, the highest level since August 2023. NAHB Chairman Alicia Huey, a custom home builder and developer from Birmingham, Ala., said, “While mortgage rates still remain too high for many prospective buyers, we anticipate that due to pent-up demand, many more buyers will enter the marketplace if mortgage rates continue to decline this year.”
In truckload equivalent terms, January’s 1.004 million single-family home starts would translate to just over 600,000 flatbed loads in the spot market (assuming three loads per home) and just under 150,000 dry van loads (assuming one load per home). Compared to January last year, flatbed carriers would have hauled 70,000 more loads last month and almost 80,000 more flatbed loads compared to January 2018 at the start of the flatbed bull market in the first half of that year.
Market watch
All rates cited below exclude fuel surcharges unless otherwise noted.
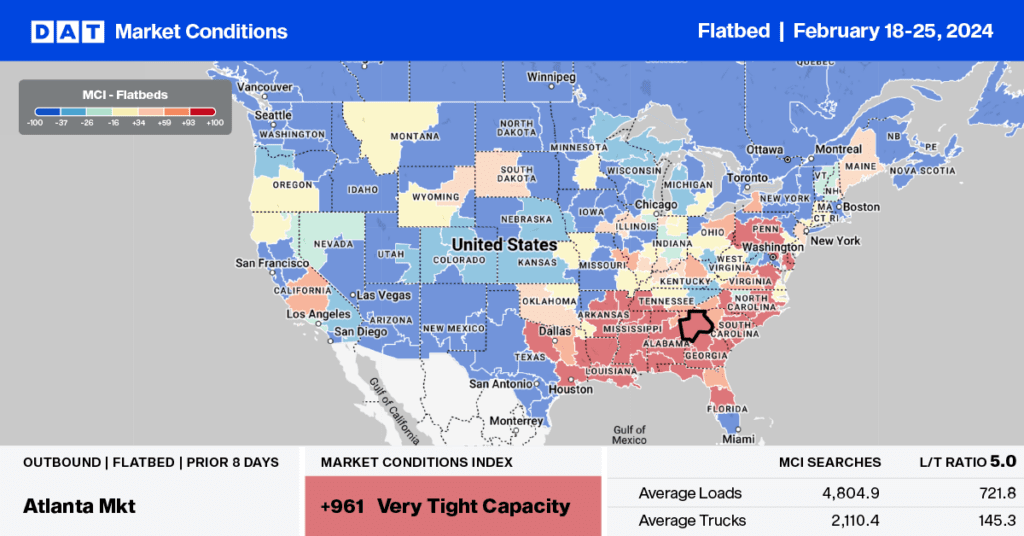
At $2.29/mile, outbound Georgia rates were flat last week, identical to 2019, and $0.14/mile lower than last year. Linehaul rates dropped by $0.02/mile, averaging $2.12/mile in the Atlanta flatbed market last week after increasing for three weeks, even though the volume of outbound loads moved increased by 4% over the same timeframe. On the number one flatbed regional lane between Atlanta and Lakeland, spot rates were up 4% w/w on a 7% higher volume, paying carriers an average of $2.47/mile, the highest since last July and $0.10/mile lower than last February.
Load-to-Truck Ratio (LTR)
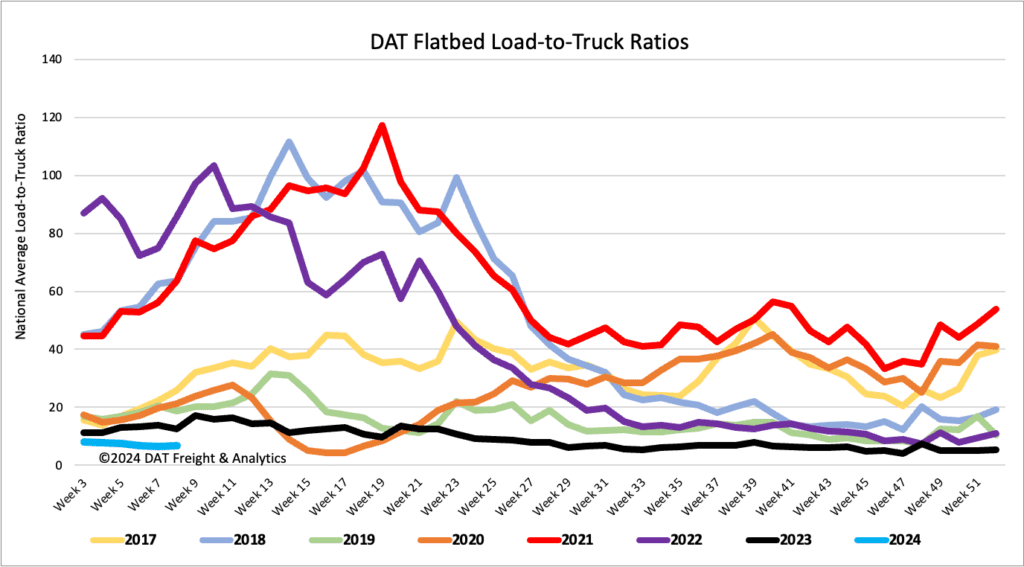
Flatbed load post (LP) volumes are trending closer to levels seen at the pandemic’s start following last week’s 1% decrease. Volumes are 53% lower than last year and 70% lower than 2020. Carrier equipment posts (EP) were also down, resulting in last week’s load-to-truck ratio decreasing by 5% to 6.76.
Spot rates
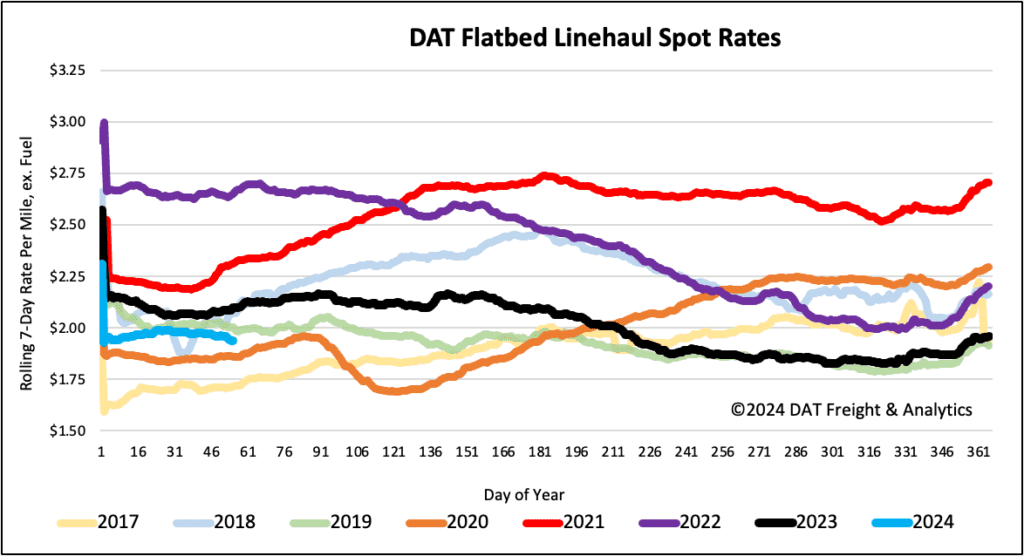
Flatbed spot rates decreased for the fourth week following last week’s $0.01/mile decrease. At $1.96/mile, the national average is around $0.16/mile lower than last year and $0.08/mile higher than in 2020.