According to Federal Reserve Economic Data (FRED), manufacturing production edged down 0.6% in January after recording no change in December. Compared to January last year, manufacturing output declined 1.3% year-over-year (y/y). The Federal Reserve’s monthly index of industrial production and the related capacity indexes and capacity utilization rates cover manufacturing, mining, and electric and gas utilities. The industrial sector, together with construction, accounts for the bulk of the variation in national output throughout the business cycle and is closely watched and quick to react to changes in the business cycle.
Get the clearest, most accurate view of the truckload marketplace with data from DAT iQ.
Tune into DAT iQ Live, live on YouTube or LinkedIn, 10am ET every Tuesday.
For truckload carriers, U.S. manufacturing generates ~58% of for-hire trucking firms’ demand (as measured in ton-miles), based on analysis by Professor Jason Miller at Michigan State University. According to Prof. Miller, “The truck transportation industry will not exit the current freight recession in terms of freight volumes until we see an uptick in U.S. manufacturing output,” and strongly cautioned trucking firms that “we are unlikely to see the market fundamentally shift in late Q1 2024 as some more optimistic prognostications have suggested.”
Market watch
All rates cited below exclude fuel surcharges unless otherwise noted.
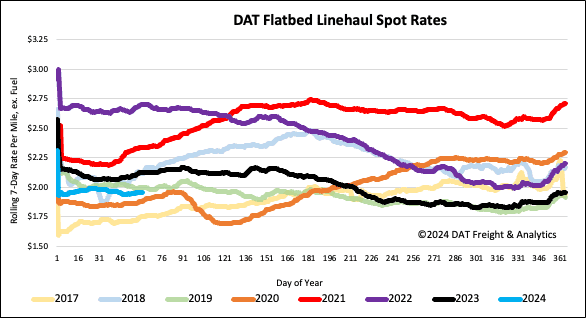
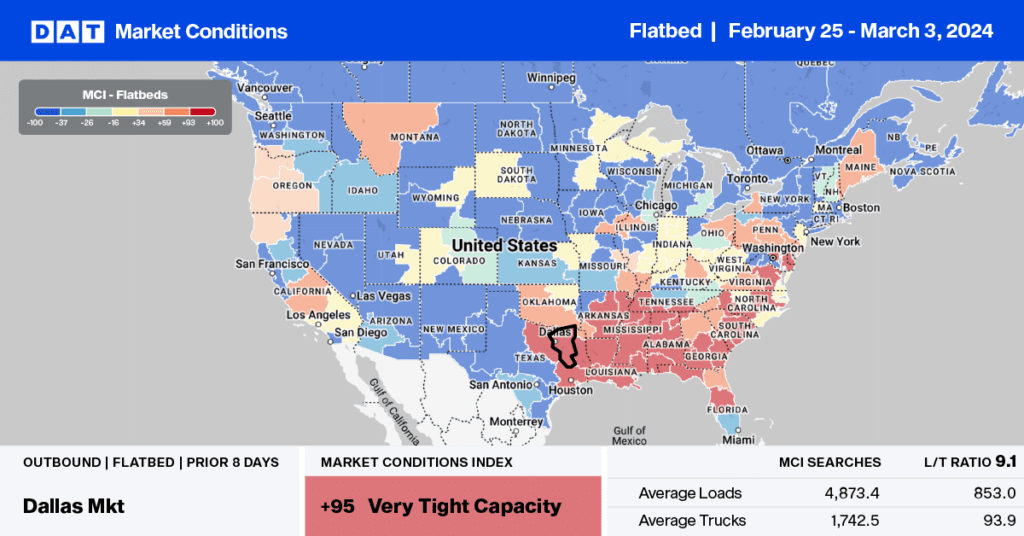
National flatbed volumes surged last week, increasing by almost 10% as large retailers and garden centers begin to replenish inventories ahead of planting season. Texas accounted for 22% of loads moved last week, following a 9% w/w increase in outbound volume. Insufficient available flatbed capacity resulted in a 3% increase in the state average linehaul rate – carriers were paid an average of $1.94/mile, up $0.06/mile and just $0.08/mile lower than in 2018.
In Houston, the largest flatbed spot market accounting for 12% of loads moved, volumes were up 15% last week while spot rates increased by $0.04/mile to $1.89/mile. Houston to Lubbock in the Permian Basin oilfield held the number one spot following a 26% increase in loads moved following the 3% increase in oil rigs since December. Carriers were paid an average of 2.34/mile for the 600-mile haul, $0.05/mile higher than the January average but $0.33/mile lower than last year.
Spot rates
With a hint of Spring in the air, we’re seeing early signs of an improvement in flatbed volumes, up 9% w/w as shippers begin to stage freight ahead of the growing season. After dropping for four weeks, flatbed linehaul rates reversed course, increasing by $0.01/mile to an average of $1.98/mile. The national average is around $0.17/mile lower than last year and $0.07/mile higher than in 2020.