The American Road & Transportation Builders Association’s (ARTBA) analysis of the recently released 2023 U.S. Department of Transportation (DOT) National Bridge Inventory (NBI) database finds that 36% of all U.S. bridges—over 222,000 spans—require major repair work or replacement. Placed end‐to‐end, these structures span over 6,100 miles – and would take over 110 hours to cross at an average speed of 55 miles per hour.
As of the end of September last year, states have committed $3.2 billion, or just 30% of available bridge formula funds, to 2,060 different bridge projects, with $7.4 billion still coming. There is progress, but it’s slow. The number of bridges in poor condition rates as “structurally deficient” declined by 560 or 1.3% to 42,391 compared to 42,951 in 2022. It would take nearly 75 years to repair them all at the current pace, according to the ARTBA.
Get the clearest, most accurate view of the truckload marketplace with data from DAT iQ.
Tune into DAT iQ Live, live on YouTube or LinkedIn, 10am ET every Tuesday.
Most state rankings stayed the same in 2023 despite improvements that have been made. The top 5 states with the most bridges in poor condition, as a percentage of their total bridge inventory, are West Virginia (20%), Iowa (19%), South Dakota (17%), Rhode Island (15%), and 5. Maine (15%). States with the most significant number of bridges in poor condition are Iowa, Pennsylvania, Illinois, Missouri, and Oklahoma.
The bridge in most need of repair, as ranked by the highest number of daily passes, is in Los Angeles on Interstate 110 over Slauson Ave, with 300,000 daily crossings, more than double the California and national average daily crossing rate.
Market watch
All rates cited below exclude fuel surcharges unless otherwise noted.
Outbound linehaul rates in Texas increased for the fourth week to an average of $2.02/mile following last week’s $0.04/mile gain. For context, that puts state average rates around $0.10/mile lower than in 2018 and $0.10/mile higher than in 2020. Linehaul rates eased in the larger Houston market, dropping by $0.06/mile to $2.03/mile following three weeks of gains.
At $2.26/mile, carriers are being paid around $0.50/mile less than last year on the high-volume lane west to Lubbock in the Permian oil basin. Loads being moved are down around 8% y/y on this lane, impacted by 12% fewer oil and gas drilling rigs compared to the start of 2023.
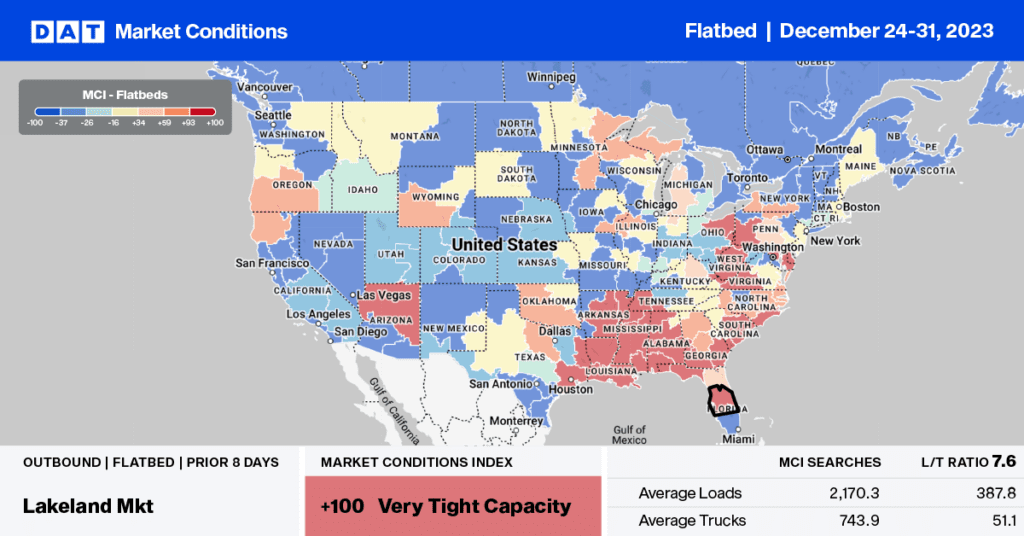
Flatbed carriers in Alabama are starting the year on a high, being paid an average of $2.26/mile for outbound loads, the highest since last October. Carriers were paid an average of $2.24/mile in the Birmingham market for outbound loads and $2.44/mile on regional hauls to Lakeland, FL.
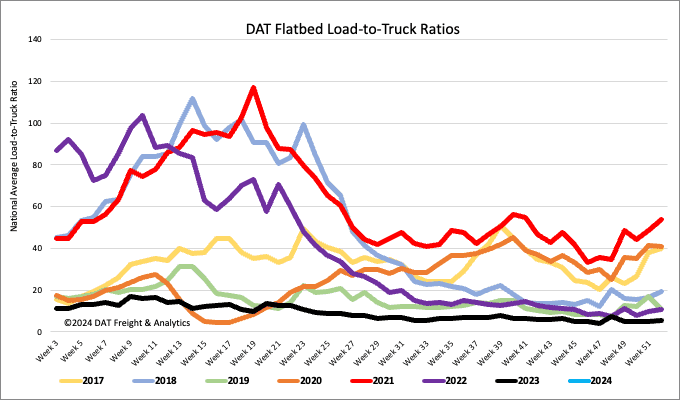
Load-to-Truck Ratio (LTR)
The volume of flatbed load posts (LP) started in 2024, just over 50% lower than last year and lower by the same amount as the long-term average for Week 1. Carrier equipment posts (EP) are 21% lower than last year, resulting in last week’s flatbed load-to-truck ratio (LTR) starting in 2024 at 9.48.
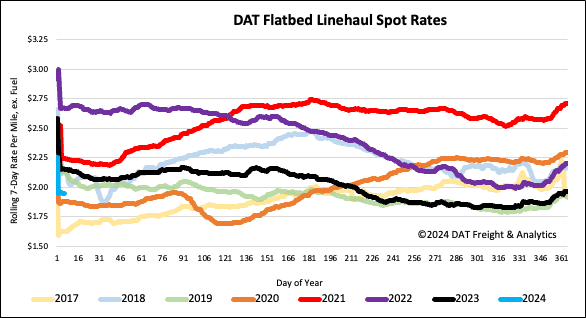
Spot rates
After ending 2023 at just under $2.00/mile, flatbed linehaul rates decreased by $0.02/mile last week, averaging $1.97/mile. Compared to Week 1 last year, last week’s linehaul rate was $0.23/mile lower but $0.05/mile higher than in 2020 as the market continued to shed capacity starting that oversupplied year much the same as it ended in 2019.