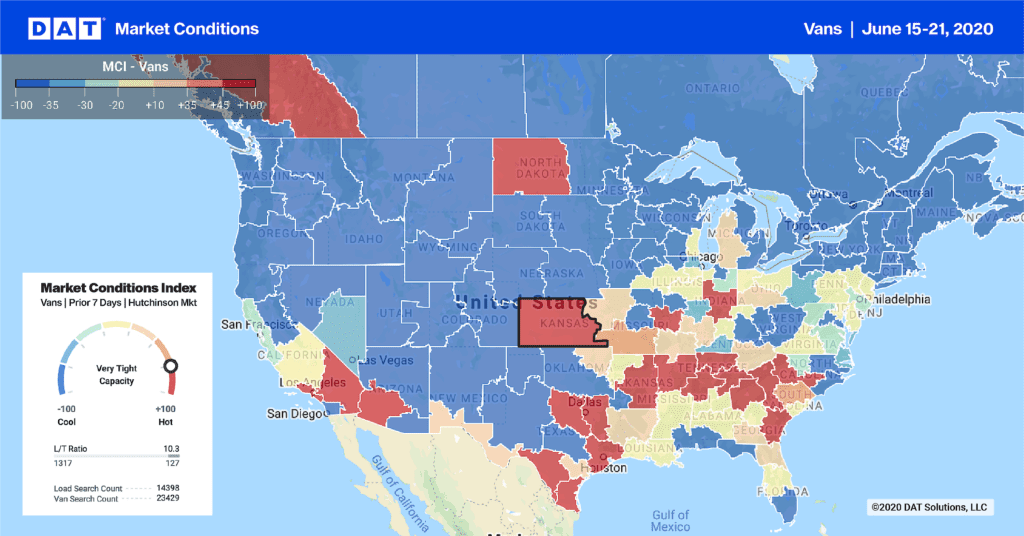
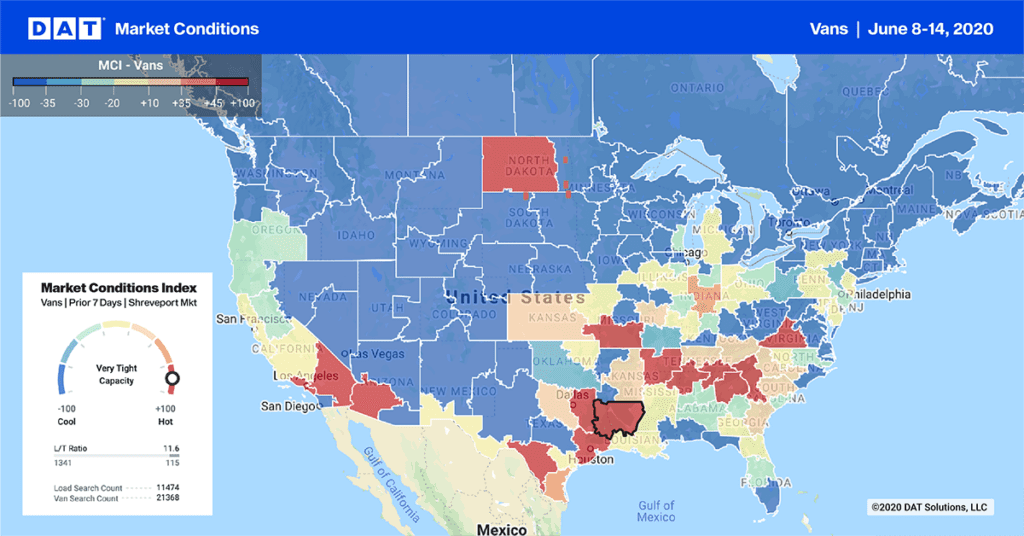
Spot market rates were up last week, but volumes fell. Hurricane Matthew likely played a role in both of those factors. Shippers paid more to move freight ahead of the storm, and then load posts dropped when the affected markets locked down at the end of the week. Inbound rates could rise in hard-hit areas like North Carolina this week.

Darker-colored states have higher load-to-truck ratios, meaning that there’s less competition for van loads in those states.
Demand for trucks is still high on the West Coast. Los Angeles was the top market for van load posts again last week, and by a large margin. Rates are still elevated on long-haul lanes heading east from L.A., due to the fallout from the Hanjin Shipping bankruptcy. The average rate on the cross-country trip from L.A. to Elizabeth, NJ hit $1.74/mile.
Seattle had been riding high for the past 4 to 6 weeks, but outbound rates slipped last week. Rates and volumes held steady in Chicago and Atlanta, which were numbers 2 and 3 for load posts, but demand was way down in Texas.

Darker-colored states have higher load-to-truck ratios, meaning that there’s less competition for reefer loads in those states.
Reefer load posts spiked in Charlotte last week ahead of Hurricane Matthew. Lots of those loads were heading to Atlanta and Florida. Otherwise, reefer trends were all over the place last week. Volumes were down, and more than half of the top 72 reefer lanes saw rates fall, but national average reefer rate added 1¢ to $1.92/mile.
Potatoes are still rolling out of Idaho, and we could see renewed pressure on rates. There’s still some tree fruit coming in other markets– mostly apples. Just like with vans, inbound reefer rates could go up this week in regions affected by Hurricane Matthew.
Out West, Fresno and nearby Sacramento were off for this time of year. The lane from Fresno to Denver was down 21¢ to $2.01/mile, and the average reefer rate for Sacramento to Salt Lake City fell 20¢ to $2.27/mile.
Lane-by-lane rate information and Hot Market Maps are available in the DAT Power load board. Rates are based on DAT RateView, with $28 billion in lane rates, updated daily, for 65,000 point-to-point lanes across North America.


