Last week’s release of the American Trucking Associations’ (ATA) For-Hire Truck Tonnage Index increased 0.5% in August after falling 1.1% in July. Compared with August 2020, the index fell 0.5%, which was the second straight year-over-year drop.
Find loads and trucks on the largest load board network in North America.
Note: All rates exclude fuel unless otherwise noted.
According to ATA Chief Economist Bob Costello:
“August’s monthly gain, while small, was the first since March, and it’s important to remember that ATA’s tonnage data is dominated by for-hire contract freight, with a very limited amount of spot market freight. I continue to believe that tonnage has not recovered to pre-pandemic levels for two main reasons: broader supply chain issues, like semiconductor shortages, as well as industry specific difficulties, including the driver shortage and lack of equipment.
Despite some supply chain issues, demand remains strong for trucking services generally. Truckload carriers are operating fewer trucks than a year earlier, which makes it difficult to increase freight volumes significantly.”
That said, replacement rates measured by comparing contract rates entering the market to those exiting, continue to rise almost across the board. Routing guides are still absorbing rate increases, which increased 7% in the two-week period from 8.27 to 9.9 (compared to 4% for the prior two-week period).
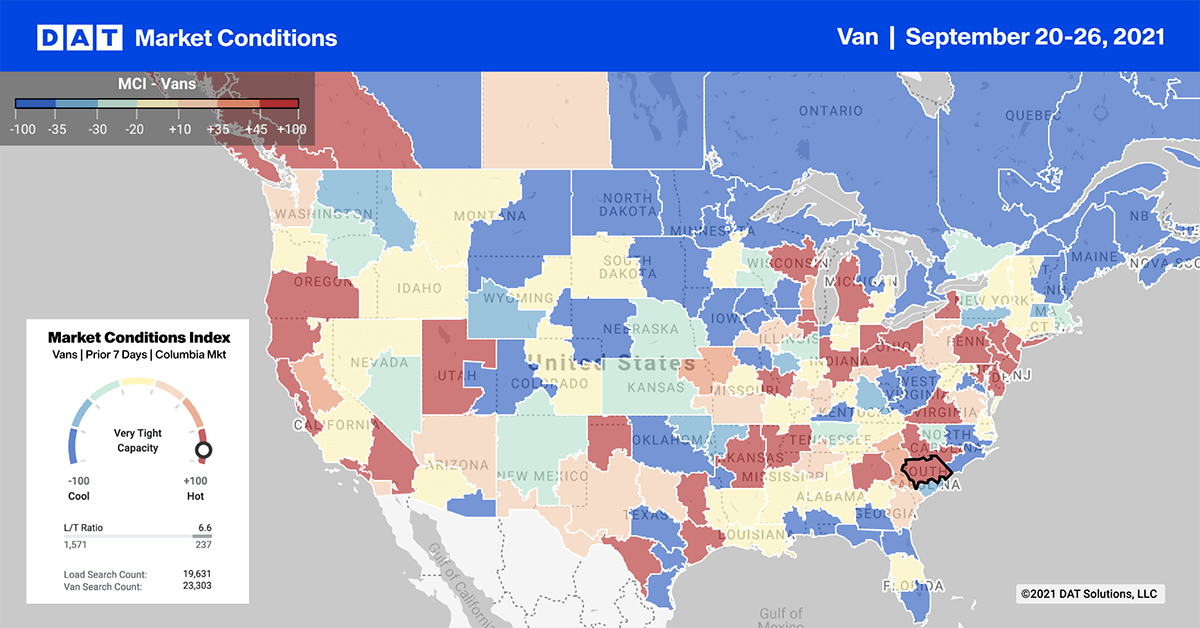
Congested ports drive volumes and spot markets
Port markets made up four of the five top markets for load posts last week. Not surprisingly, Los Angeles and Ontario in California were the top two ports by a long way ahead of Elizabeth, NJ and Philadelphia, PA. Atlanta came in at number five.
For the last three weeks, shippers have been pushing higher weekly volumes into the truckload spot market to meet on-time delivery requirements, compounding the struggles at the West Coast ports. Both the Ports of Long Beach and Los Angeles are working to clear the backlog of large container vessels waiting to unload. In the Los Angeles market, volumes increased by 12% last week followed by nearby Ontario, which increased by 10%.
As of Monday, the Port of Savannah had 25 container vessels also waiting to unload with a corresponding flow-on effect into the truckload spot market. Savannah outbound volumes were up 17% last week.
The backlog from the recent closure of the port in Philadelphia appears to have cleared. Truckload volumes were down 5% last week but capacity remains tight. Outbound spot rates increased by $0.03/mile to an average outbound rate of $2.61/mile — now up for the fourth week in a row.
Spot rates
Since Labor Day, dry van spots have plateaued just over the $2.50/mile mark. There was almost no change in last week’s national average spot rate, which stayed at $2.51/mile. Compared to the same week last year, dry van rates are still 13% or $0.33/mile higher.
Of our Top 100 lanes (for loads moved), spot rates:
- Increased on 35 lanes (compared to 21 the week prior)
- Remained neutral on 33 lanes (compared to 35)
- Decreased on 32 lanes (compared to 44)
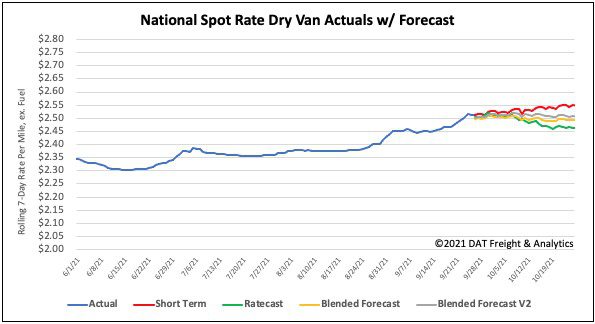
How to interpret the rate forecast:
- Ratecast: DAT’s core forecasting model
- Short Term Scenario: Formerly the pessimistic model that focuses on a more near-term historical dataset
- Blended Scenario: More heavily weighted towards the longer-term models
- Blended Scenario v2: More heavily weighted towards the shorter-term models