Last week saw a huge surge in demand and prices on the spot market, as shippers closed the books on Q2 and moved freight into place ahead of the Fourth of July weekend. But as we hit the halfway mark for the year, the trucking industry sits at a crossroads.
Freight volumes and rates typically cool after July 4th, but unlike in previous years where seasonality is predictable, this year no one is really sure what lies ahead. Today’s trucking landscape includes record unemployment levels, uncertain and inconsistent consumer demand, state economies that are reopening at different speeds, threats of exponentially more COVID-19 outbreaks, and PPP loans and unemployment benefits that are in a state of flux.
Our recent FMIC report showed that contract freight volumes were down 6.3% year-over-year in May. Those volumes did increase 3% from the previous month, which is some positive news in what’s been an otherwise grim freight market. FMIC reporting shows that it’s still too early to know the final shape of the economic recovery, and part of that is due to state economies reopening on different timelines and following different standards. This means the pace of the freight recovery will vary by region. Procuring new rates and managing national freight networks will be challenging for shippers and carriers as state-by-state differences emerge.
Get access to the most loads and trucks on the DAT One load board network.
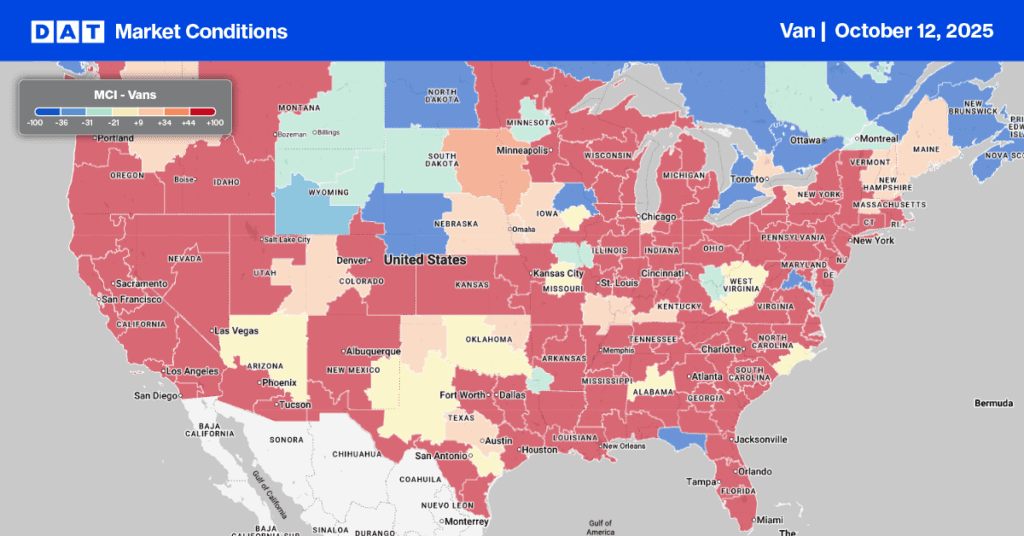
Dry van supply and demand
The Market Conditions Map shows, as more and more states reopen for business, shippers are anticipating stronger consumer demand. As a result, dry van load volumes increased by 19% last week. The last time we observed volumes this high was in early June 2018, when capacity was much tighter and demand stronger.
Capacity has tightened across the Southeast and Midwest where states have been reopened the longest, which has contributed to more regional loads in the less than 550 mile length of haul range. Loads in the medium haul category (251-550 miles) increased by 9% and shorter haul loads in the 0-250 mile range increased by 18% in June. Long haul load volumes over 550 miles decreased by 6% over the same period.
> Learn more about the Market Conditions Index
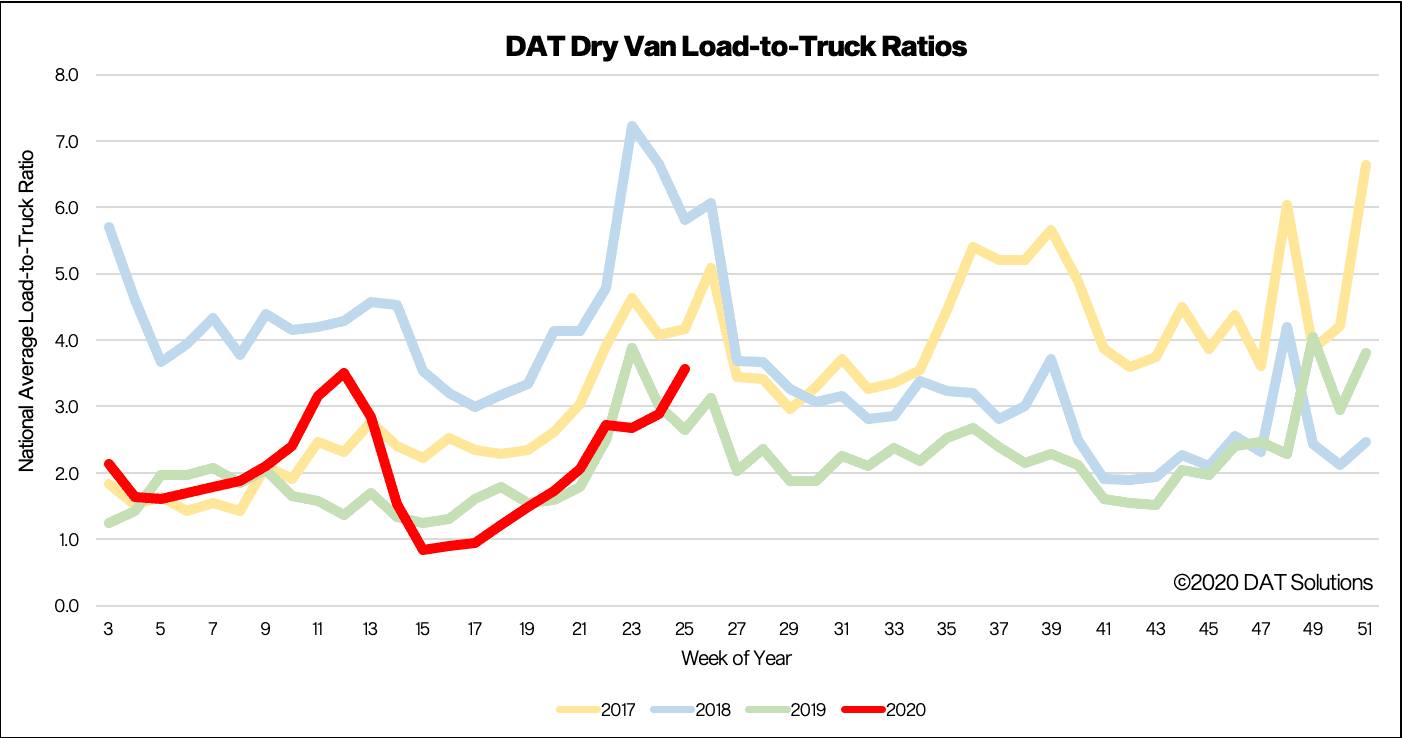
We typically see higher load volumes in the weeks leading up to the July 4th holiday break, and with end-of-month, end-of-quarter and end-of-half year shipping occurring midweek this year, spot market loads increased for the eleventh consecutive week. The load-to-truck ratio (LTR) increased by 22% last week to 4.34, with capacity tightening as truck searches dropped for the third straight week, decreasing by 3% week over week and 5% year over year.
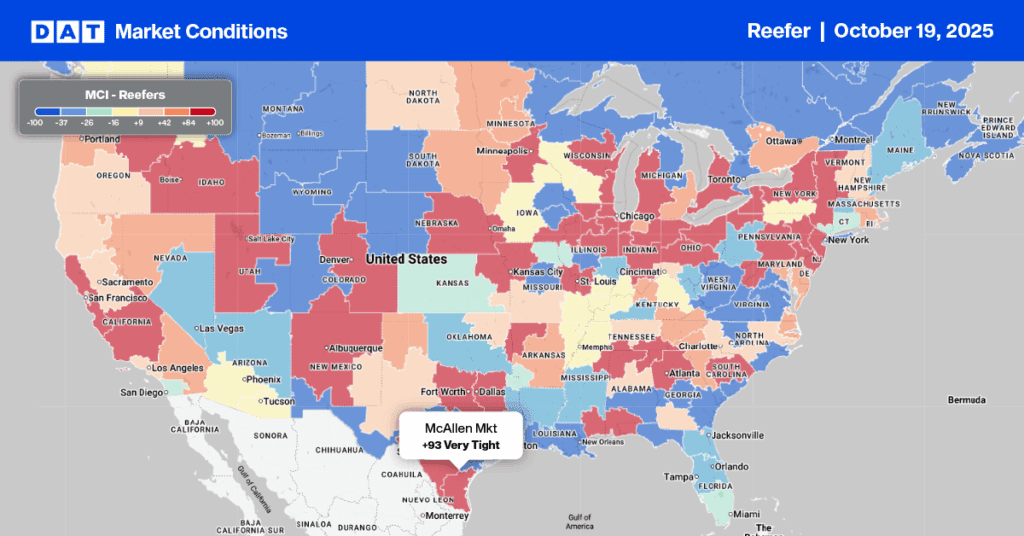
Reefer supply and demand
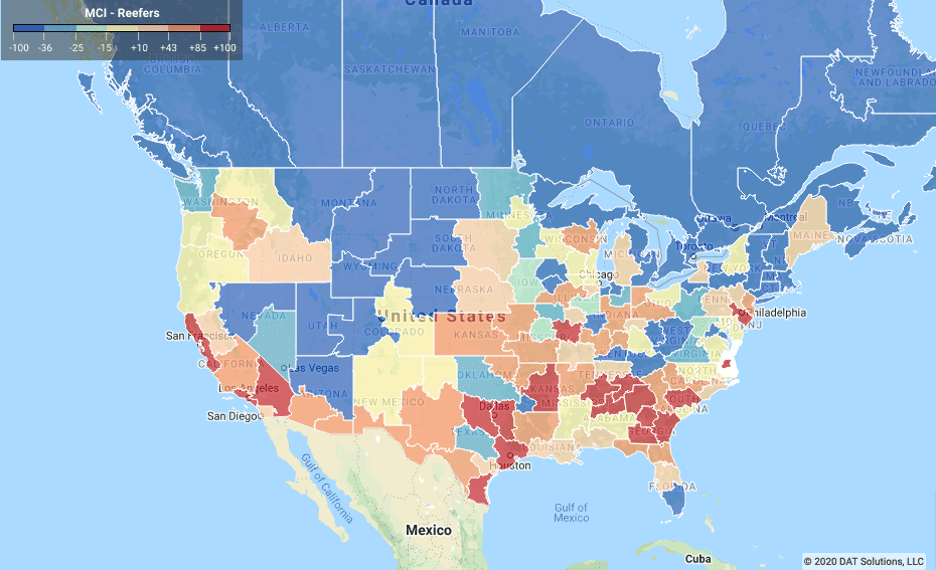
Reefer capacity remains tighter in the Southeast and West Coast, where produce season continues to drive demand push prices upward upward. That’s despite the fact that demand from food services sector and restaurants has been much lower. The USDA Farmers to Families Food Box program is closing much of that gap and giving growers a market for their summer crops. The program is expected to run through August, with growers already delivering close to 20 million 20-pound boxes to families in need – that’s the equivalent of 9,500 truckloads of produce so far, which is about half the total volume the program expects to handle.
> Learn more about the Market Conditions Index
The Pacific Northwest also heated up, as growers anticipate a strong July 4th sales weekend, with the Rainier Sweet Cherry driving up higher volumes. The Rainier Cherry is traditionally very popular over the July 4 weekend. That crop only has an 8-week season, which has led to a rush of demand for out of the Pendleton, OR, and Twin Falls, ID, markets. Shipping volumes for export and domestic consumption average around 1,250 truckloads per week, and since cherries don’t ripen after harvest, there is considerable time pressure on carriers to move loads to major markets like Denver, Houston and Salt Lake City and as far away as Atlanta and Lakeland (the top 5 markets for reefer loads out of the PNW).
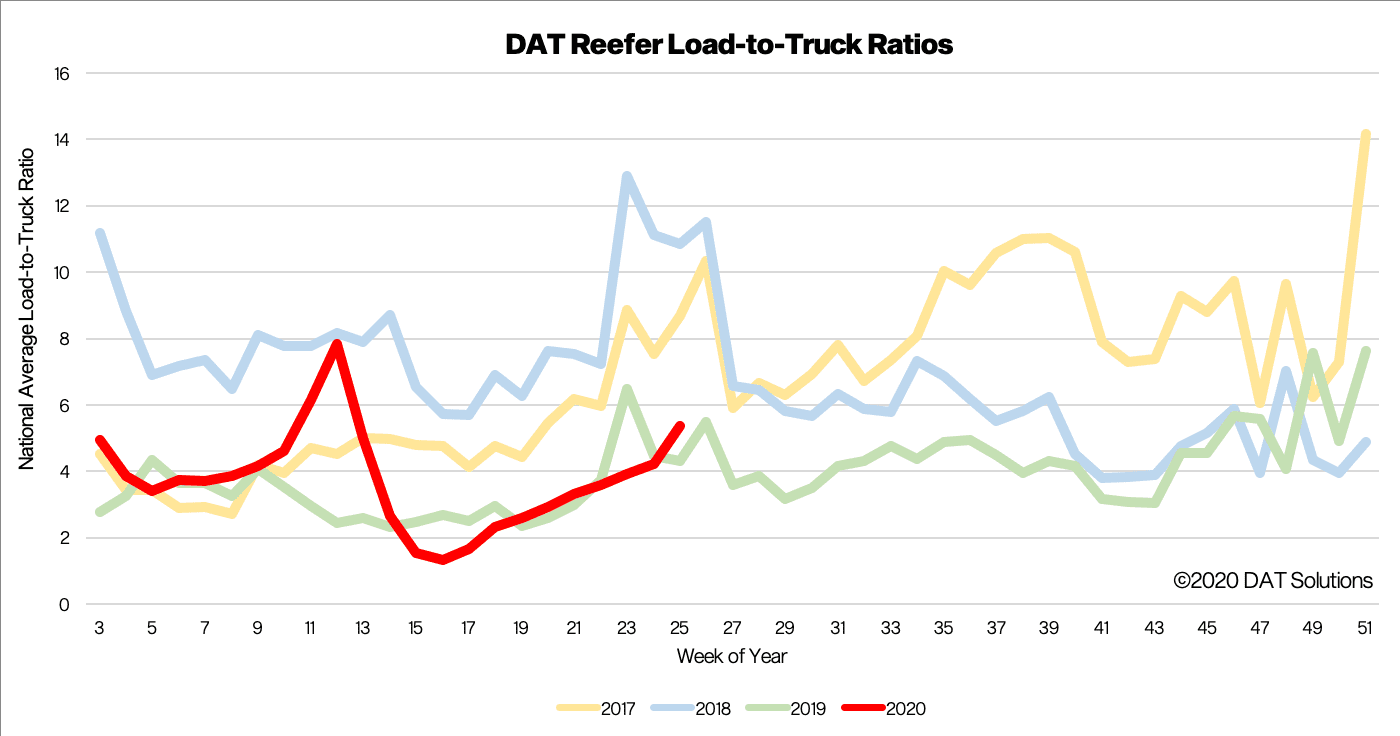
The reefer LTR jumped 40% to 7.47 last week, following a 30% increase in reefer load posts and 25% decrease in truck searches. The last time we observed an LTR this high for temperature-controlled loads was back in mid-March, when shipping peaked to restock stores immediately following the pandemic lockdown. The reefer LTR is also up 28% y/y.
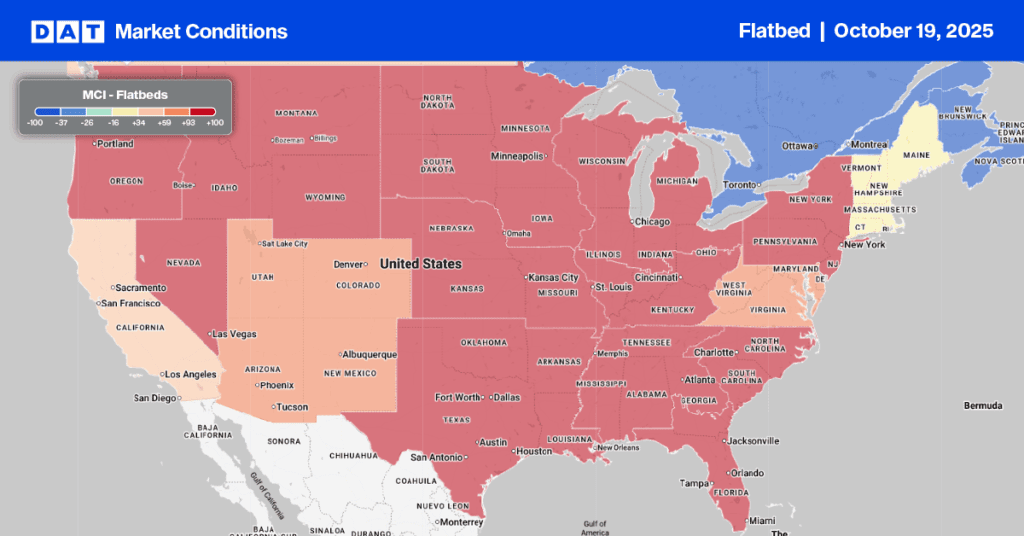
Flatbed supply and demand
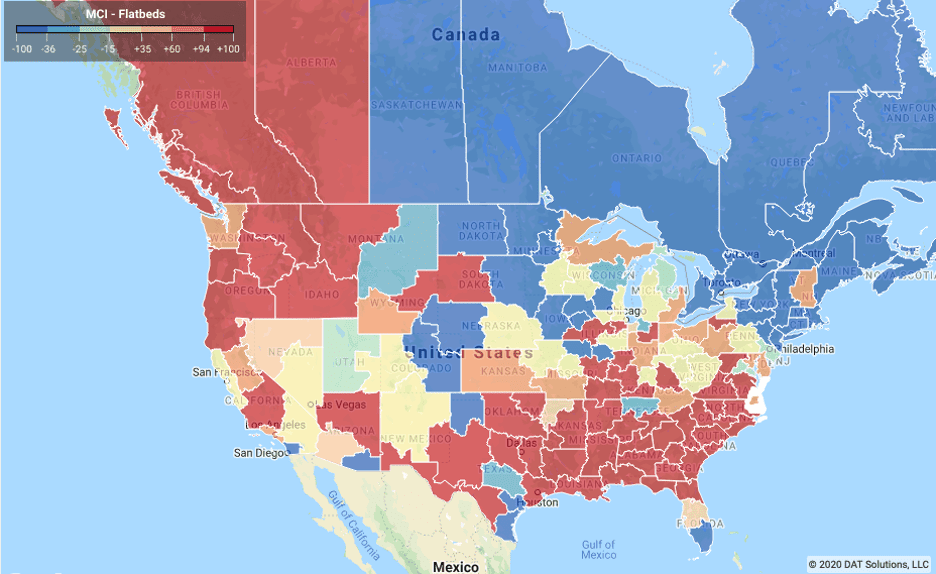
There’s a lot of strength in the flatbed markets, which have gotten a boost from much better than expected home construction numbers. In May, building permits rose 14% in from April, with a 12% increase in single-family homes, according to the U.S. Census Bureau. Both are positive indicators for shippers and flatbed carriers.
Currently there’s a shortage of the pressure-treated lumber used in construction, landscaping and home improvement, which is also driving higher demand for flatbeds. The COVID-19 shutdown meant many homeowners had more time to work on home improvement projects, creating unseasonably earlier demand for building materials that are typically stockpiled in late winter and early spring. The lockdown of lumber mill workers during the pandemic also exacerbated the shortage.
As a result, we’re seeing tight capacity and higher flatbed volumes in the top-lumber producing states including Oregon, Washington, Georgia, Alabama, California, Arkansas, Mississippi, North Carolina and Texas. Canada is the world’s second largest softwood producer, and75% of Canada’s softwood production located in British Columbia and Alberta, where flatbed volumes are also heating up. About half of that production is exported to the United States.
Flatbed load posts are up 7% w/w but down slightly by 2% y/y, which has contributed to the flatbed LTR jumping by 19% w/w and 30% y/y. Driven by higher demand for finished and treated lumber, volumes are on track to soon reach 2017 levels when industrial production and higher oil prices were much higher contributing to the flatbed capacity crunch in the first half of 2017.
Spot market pricing trends and forecasts
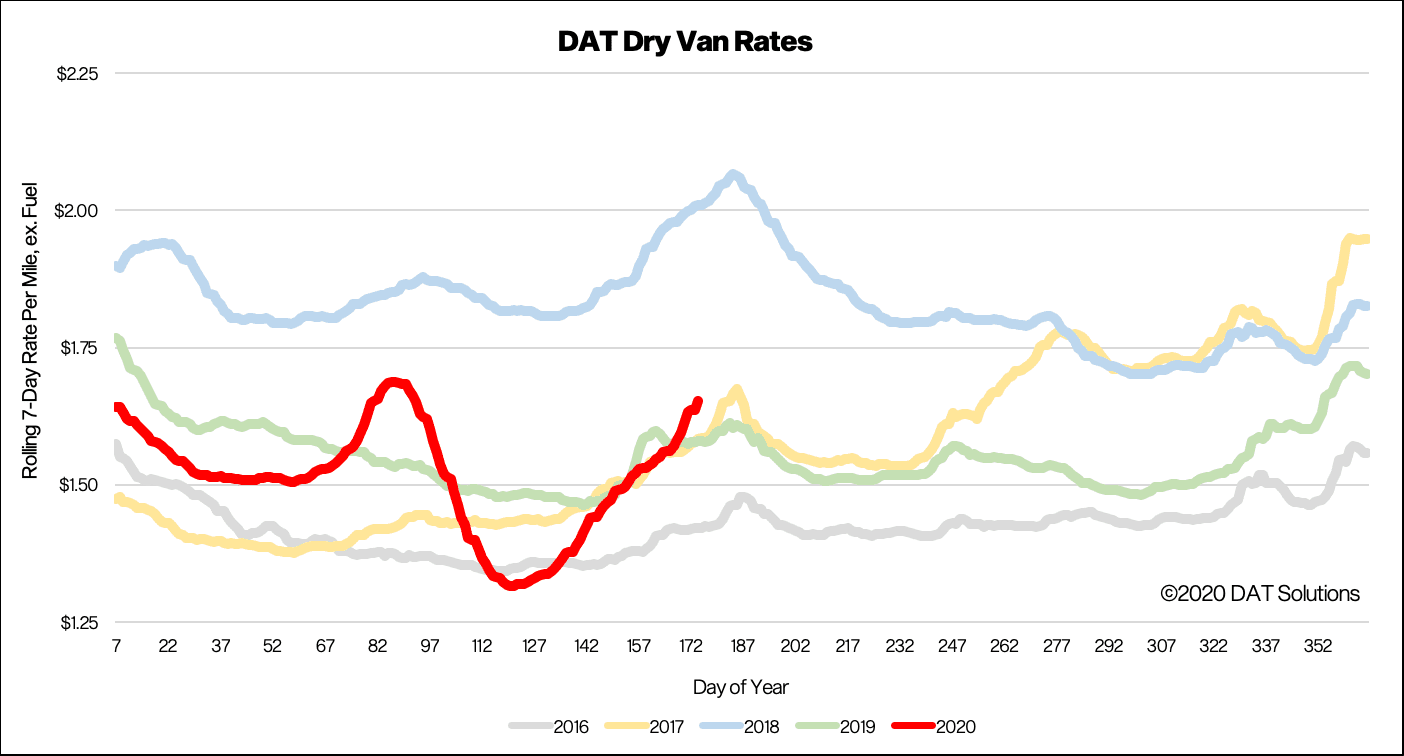
Dry van spot rates continue to rise, and are now above 2016, 2017 and 2019 levels. Last week, national average van rates peaked at $1.73/mile, excluding fuel surcharges, after increasing 12 cents per mile w/w. Shippers are stocking up warehouses in anticipation of higher demand, as states reopen their economies.
The big question for freight market volumes this week is the possible impact of escalating COVID-19 outbreaks, which threatens to slow down the pace of reopening in Florida, Nevada, South Carolina and Texas. Only 11 of 50 states have an R-value (a key measure of how fast the virus is spreading) lower than 1.0 this week – a level below which the virus stops spreading.
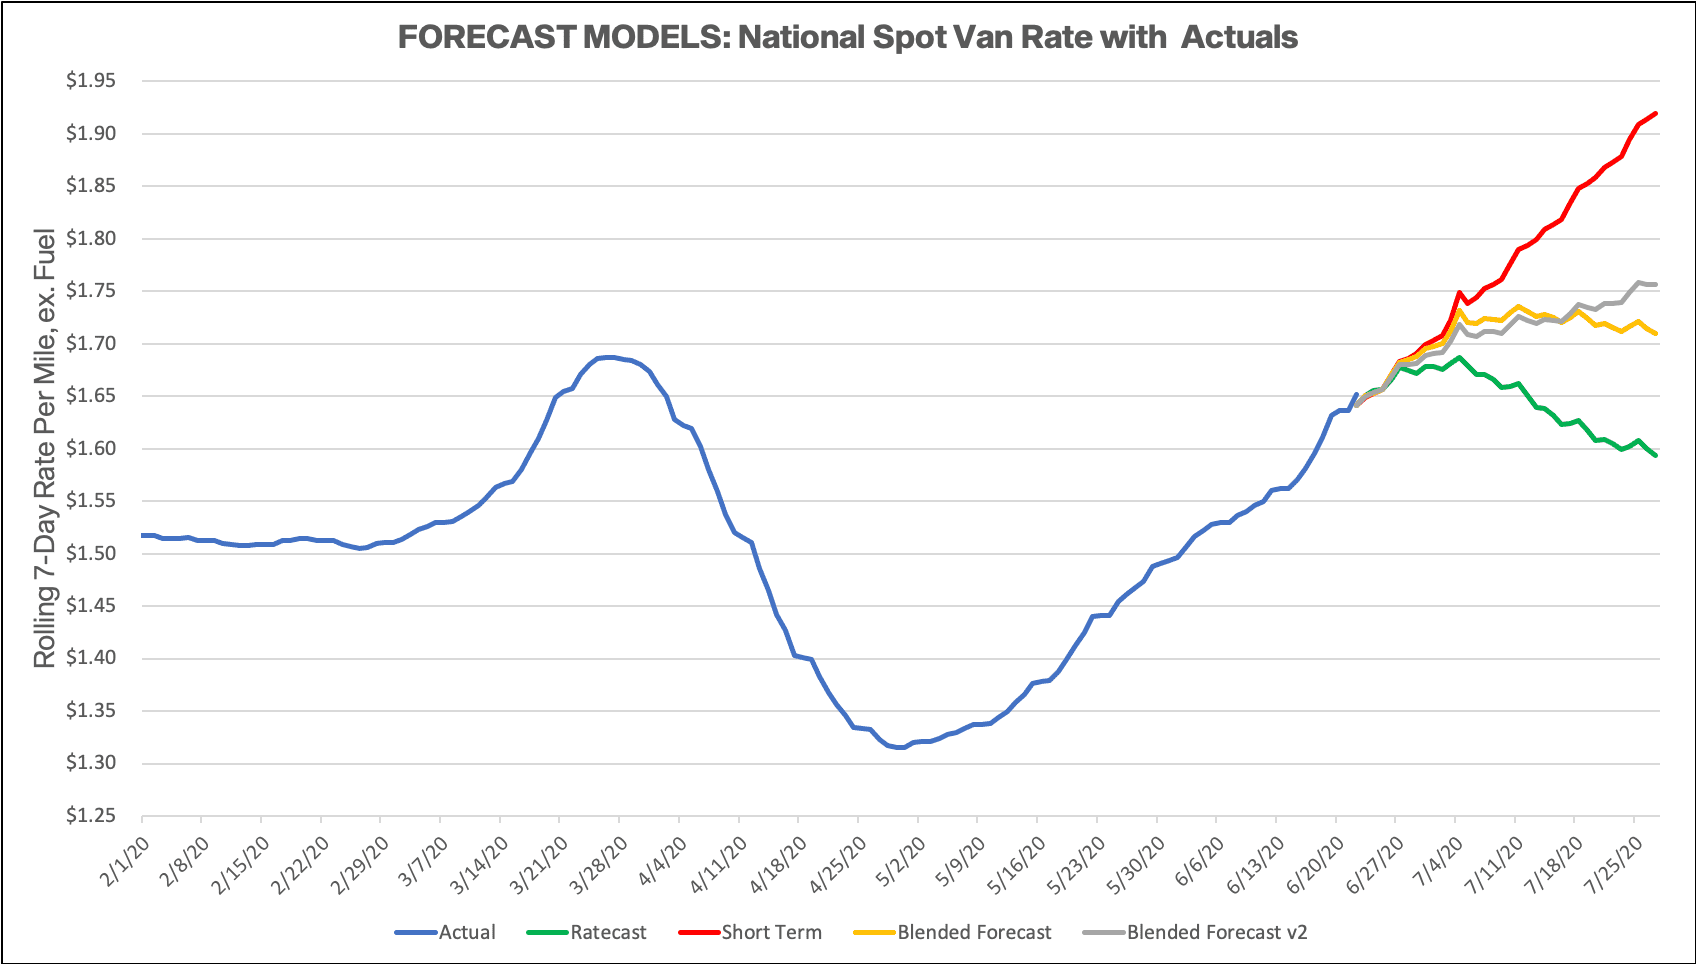
Dry van rates typically cool off after July 4th, so we expect some tightness in capacity this week as shippers meet their end of month, quarter and half-year shipping targets. Our Ratecast model predicts national rate will peak a few pennies higher at $1.67/mile excl. FSC.
Note: It warrants mentioning that forecasting during this volatile and uncertain time period is difficult. Our team is working diligently to update and adjust the models, but new information becomes available at a rapid pace, which further complicates the issue. DAT would typically not publish these types of preliminary studies, but we feel that the benefit of sharing our observations far outweighs the risk. We ask that you please treat these statements and exhibits as directional and consider them as a variable in your own analyses.
How to interpret the rate forecast
1. Ratecast Prediction: DAT’s core forecasting model estimate showing continued optimism and rate growth.
2. Short Term Scenario: Formerly the pessimistic model that focuses on a more near-term historical dataset.
3. Blended Scenario: More heavily weighted towards the longer-term models.
4. Blended Scenario v2: More heavily weighted towards the shorter-term models.
> Learn more about Ratecast predictions available in RateView
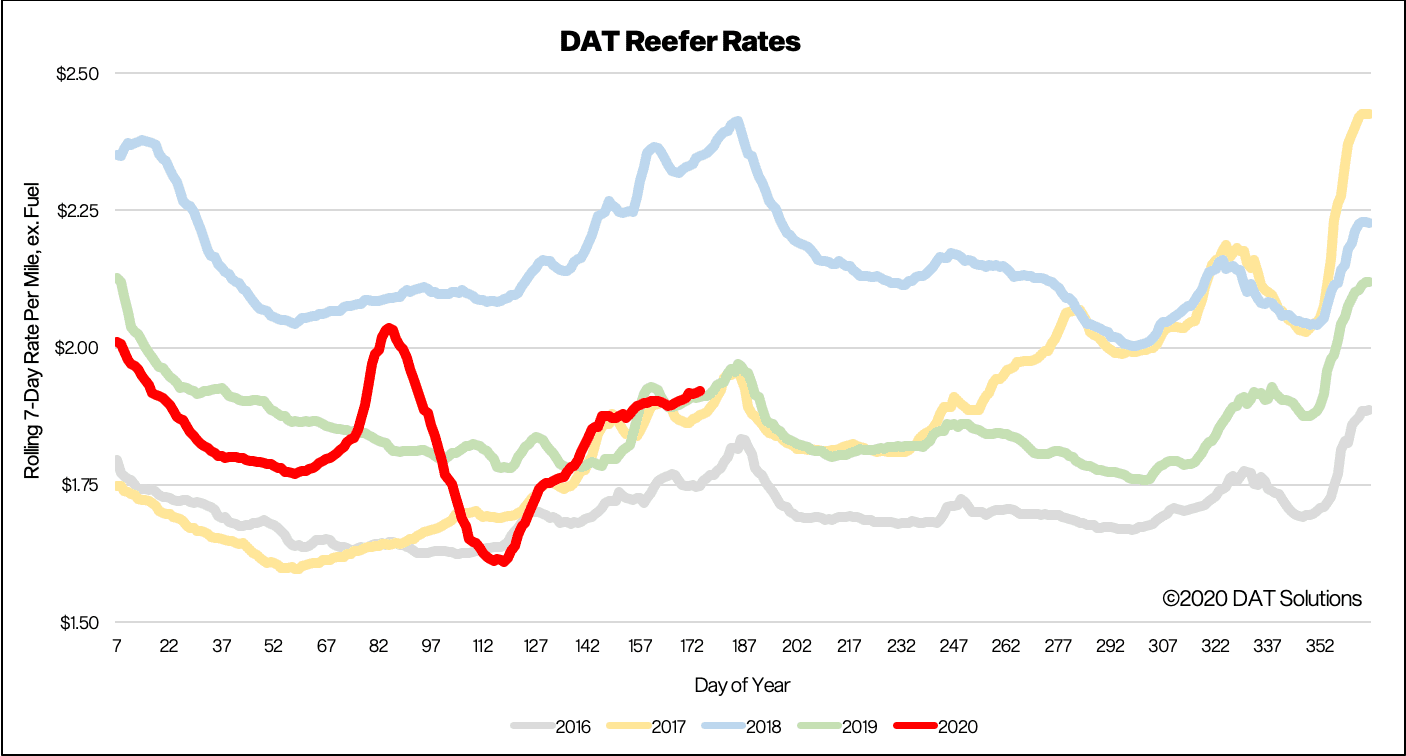
National average reefer rates moved up to $1.99/mile, excluding FSC, last week, with more upward pressure expected on spot rates through the end of this week, as shippers move produce into markets to meet seasonal July 4th demand. Reefer rates are also up 8% y/y as capacity continues to tighten, with fewer searches for reefer loads on the DAT One load board network, and a 30% increase in reefer spot market load posts.
Reefer rates typically retreat after July 4th, with our Ratecast model predicting rates will peak at $1.95/mile excl. FSC before dropping off quickly. Produce season drives a lot of reefer volume this time of the year, with domestic truckloads of fruit and vegetables up 3% according to the USDA this week. This increase contributed to the increase in spot rates last week ,with truck capacity tight in Central and South Florida and South Carolina (USDA). Domestic shipments increased by 753 loads last week, but imported produce shipments dropped by 11% or 1,768 fewer truckloads for a combined drop in national fruit and vegetables truckloads of 1,005 last week.
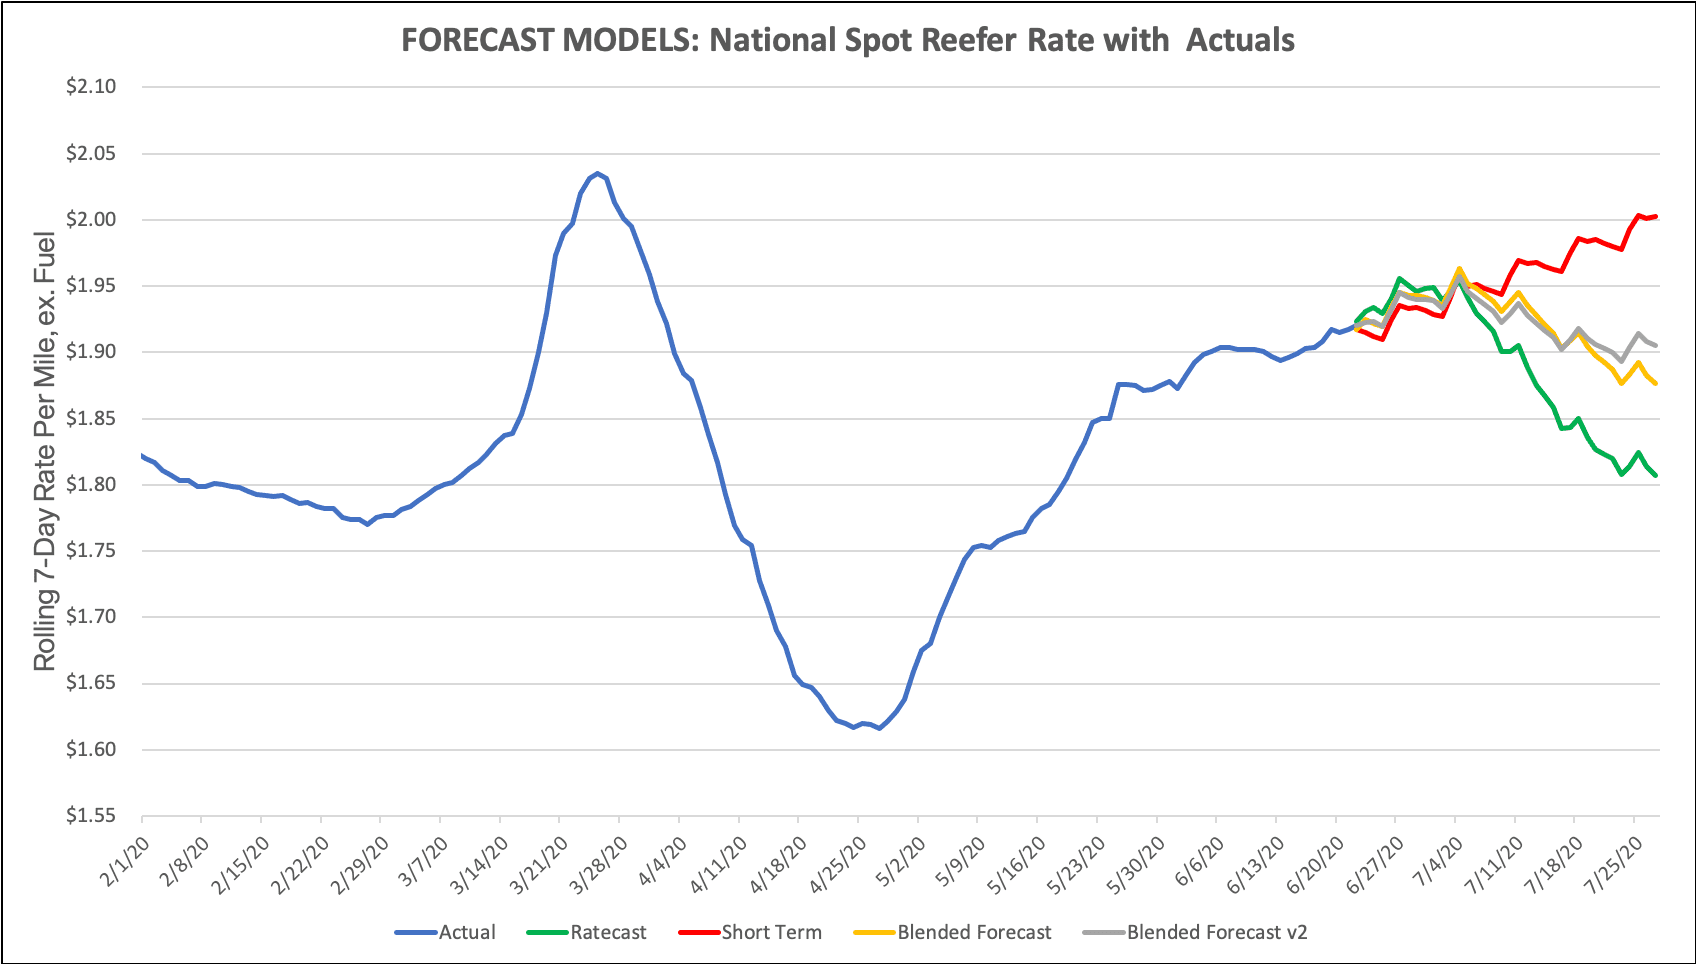
1. Ratecast Prediction: DAT’s core forecasting model estimate showing continued optimism and rate growth.
2. Short Term Scenario: Formerly the pessimistic model that focuses on a more near-term historical dataset.
3. Blended Scenario: More heavily weighted towards the longer-term models.
4. Blended Scenario v2: More heavily weighted towards the shorter-term models.
> Learn more about Ratecast predictions available in RateView
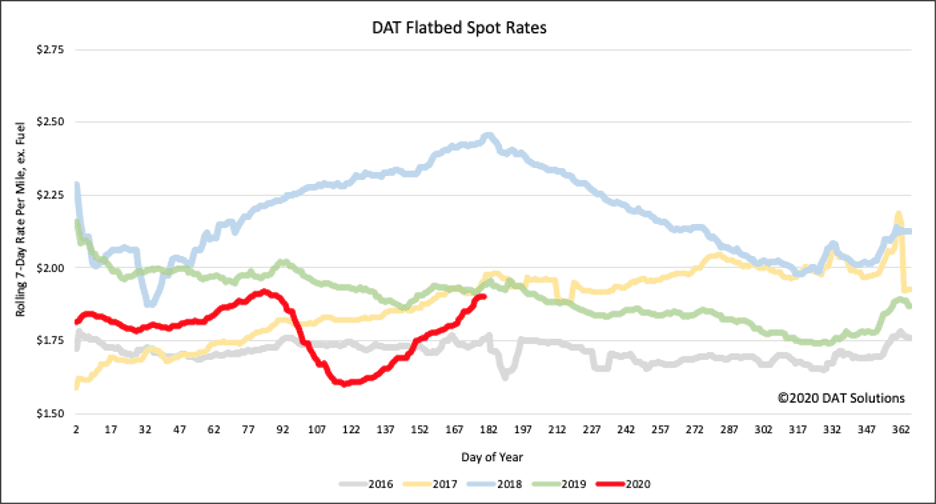
Strong demand for flatbeds continues to push national average spot rates higher to reach $1.73/mile excluding FSC last week. Since bottoming on April 29 at $1.60/mile, flatbed rates have steadily risen.
Last week, load posts were up 9% w/w and 15% y/y, while trucks searching for loads were down 19% y/y as capacity continues to tighten drive by demand in the building industry. Our Ratecast model prediction (green line) sees rates flattening slightly during July but staying in the $1.85 to $1.90/mile range, which is consistent with the current strong demand for we’re seeing in the market for flatbed carriers in the building industry
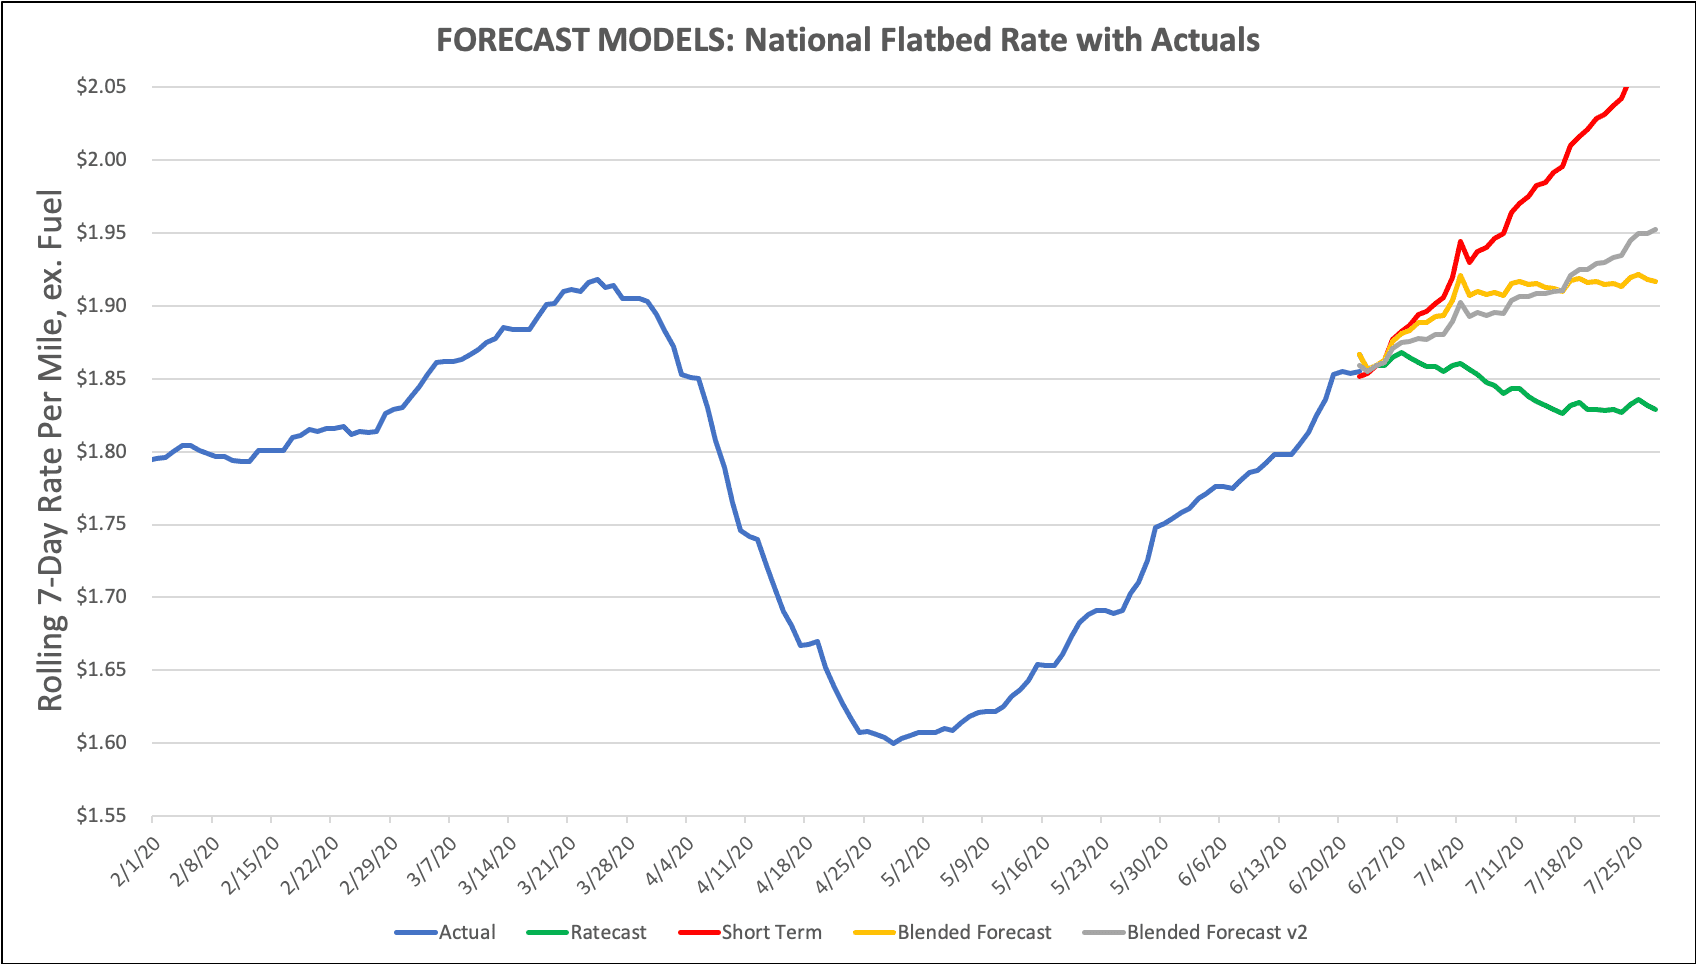
1. Ratecast Prediction: DAT’s core forecasting model estimate showing continued optimism and rate growth.
2. Short Term Scenario: Formerly the pessimistic model that focuses on a more near-term historical dataset.
3. Blended Scenario: More heavily weighted towards the longer-term models.
4. Blended Scenario v2: More heavily weighted towards the shorter-term models.
> Learn more about Ratecast predictions available in RateView
Our update will be refreshed next week, or sooner if conditions change materially. Visit dat.com/blog for the latest information. Any questions about this report or market conditions can be emailed to askIQ@dat.com.
We are also making available, free of charge, the DAT iQ Daily 50, which is a daily report of the top 50 lanes by volume with a week’s worth of history and predictions using the Ratecast model. Request access at askiq@dat.com.