The Peruvian imported blueberry program is now in full swing, driving significant U.S. truckload activity at key American ports. The majority of Peruvian blueberry imports currently enter the U.S. through four main ports: Philadelphia, Port Hueneme (California), Miami, and Los Angeles. Philadelphia is the leading gateway, receiving approximately 57% of all Peruvian blueberry shipments, which is followed by Port Hueneme at 24%, Miami at 13%, and Los Angeles at 2%.
Get the clearest, most accurate view of the truckload marketplace with data from DAT iQ.
Tune into DAT iQ Live, live on YouTube or LinkedIn, 10am ET every Tuesday.
The U.S. imports approximately 165,346 tons (or about 8,300 refrigerated truckloads) of blueberries from Peru annually. This import season typically spans from October to April, with shipments escalating in August, reaching their peak between September and November, and concluding by late March or early April.
Peru is a crucial supplier of blueberries to the U.S., primarily because its growing season complements that of North America. This ensures a consistent, year-round availability of fresh blueberries, particularly when U.S. domestic production is low. Peru’s coastal climate, characterized by mild temperatures, minimal rainfall, and accessible irrigation, facilitates nearly continuous production and export. The country’s peak season, from August to April, provides retailers and consumers with fresh blueberries outside the conventional North American growing season.
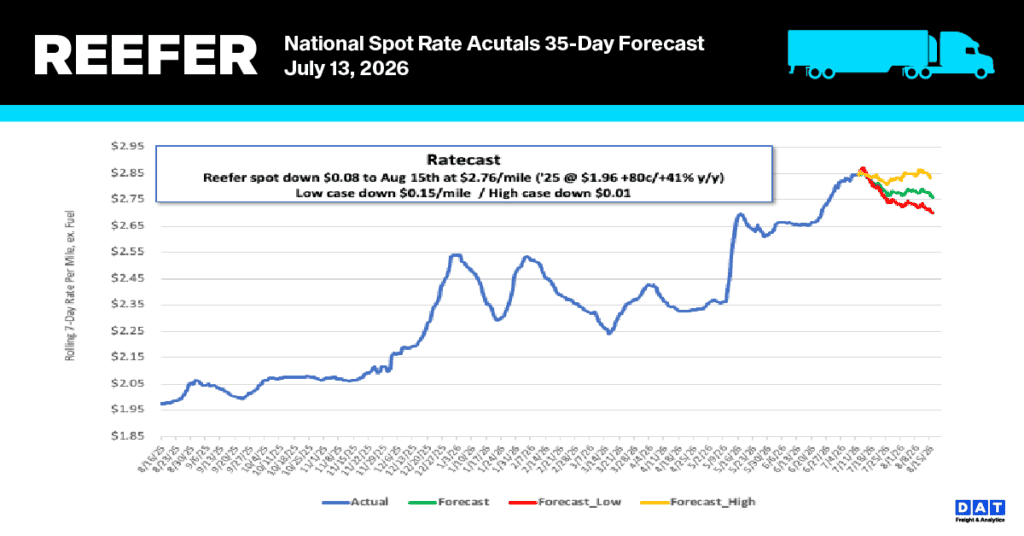
Reefer National spot rates
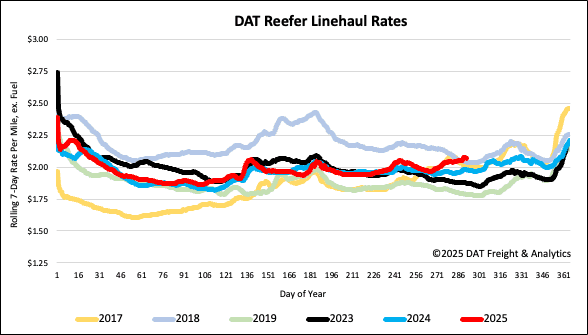
Last week, the national 7-day rolling average for reefer carriers saw an increase of just under a penny per mile, reaching $2.08 per mile. This figure continues to outpace previous years, now standing $0.09 or 4% higher than last year and $0.19 above 2023.
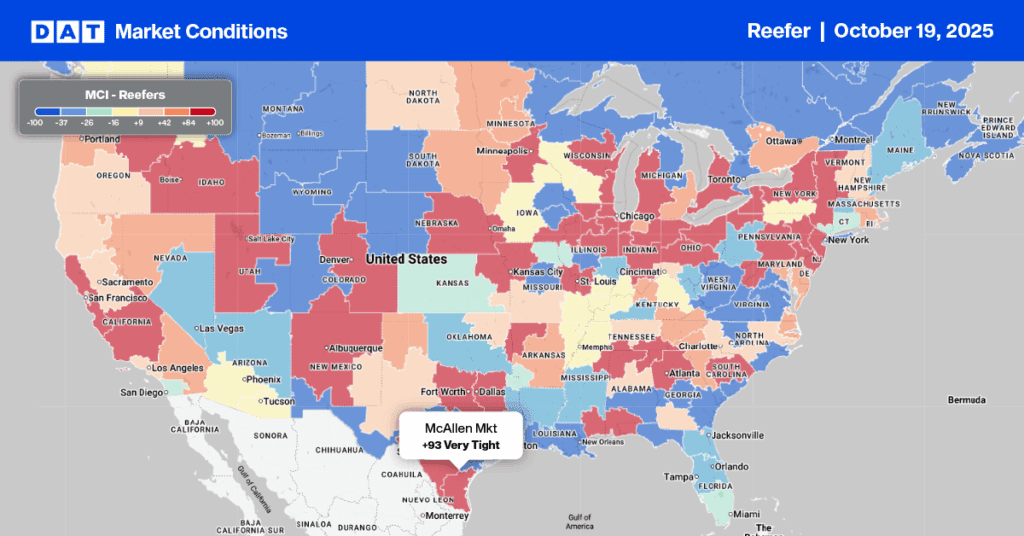
Reefer Market Watch
Last week, reefer load post volumes saw a 2% increase, partly due to the extended watermelon season. Delaware, in particular, is experiencing an unusual late-October watermelon season, diverging from its usual mid-July to early September peak. This extension has led to a slight shortage of refrigerated trucks for watermelon shipments, especially to the Atlanta market, benefiting Southeast regional truckload carriers. A similar reefer truck shortage was also reported in Southwest Indiana and Southeast Illinois. Notably, outbound Illinois state average reefer rates are currently $2.84 per mile, marking a $0.26 per mile (nearly 10%) increase compared to last year.
Reefer spot rates in McAllen are experiencing a continued tightening, with a $0.07 per mile increase last week, bringing the average to $2.15 per mile for outbound loads. This figure is also $0.06 higher than rates observed at the same time last year.
Specifically, loads from McAllen to Fort Worth are commanding $2.49 per mile, a $0.09 increase from the previous week. In contrast, rates for loads destined for Los Angeles have decreased by $0.11 to $1.36 per mile. This decline follows a period of very tight capacity on the McAllen to Los Angeles lane over the past two weeks.
Enforcement activities by Immigration and Customs Enforcement (ICE) at Florida scale houses are impacting capacity for brokers and increasing load post volumes. Since Florida converted all truck weigh and agricultural inspection stations into checkpoints for ICE to conduct immigration status and English Language Proficiency (ELP) assessments on commercial drivers, outbound load posts have risen sharply—18% overall and 22% in the last week alone.
Spot rates have risen by $0.11 per mile over the last month, reaching an average of $1.06, not including fuel. Florida’s distinctive funnel-shaped geography, particularly its southern regions, is contributing to this trend. As one moves further south into Florida, load postings increase, as does carriers’ unwillingness to be trapped there. Last week, Miami saw a significant 43% jump in load posts, while Jacksonville experienced a more moderate 15% increase.