Load-to-truck ratios surged last week, as year-end demand and ongoing bad weather faced off against a relative shortage of trucks between two holidays. The calendar was a big factor, as shippers try to push freight out the door before the end of the fiscal year or quarter. Truck drivers really like to be home for the holidays, though, and who can blame them? Large carriers might still make all their scheduled deliveries, but they don’t take a lot of exception freight when fewer drivers are willing to work.
The impact of these trends played out differently, depending on the equipment type and geographic location. Here are last week’s Hot States maps for van, reefer and flatbed:
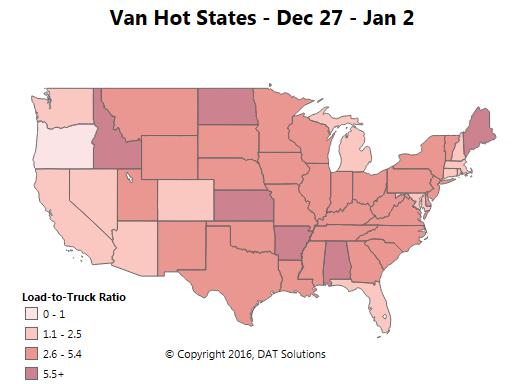
Vans had a quiet week on the West Coast, but there were serious truck shortages in a handful of states, and the national load-to-truck ratio rocketed up from 1.9 to to 3.4 loads per truck. That’s huge, but van rates held steady at a national average of $1.71 per mile. Why? Head haul rate increases were offset by declines in back hauls. (The head haul lane is the one with the higher rate in a round-trip route, because there is more demand for trucks from Chicago to Dallas than from Dallas to Chicago, for example.)
This week, carriers should be able to find van loads easily in these Hot Markets, where exceptional load volume (more than 1,000 load posts per day) plus a shortage of trucks equals some great opportunities:
- Minneapolis, MN
- Green Bay, WI
- Lubbock, TX
- Laredo, TX
- Hutchinson, KS
- Pittsburgh, PA
- Philadelphia, PA

Reefer rates rose 2¢ last week, to $1.95 per mile, as the load-to-truck ratio nearly doubled, from 5.2 to 9.6 loads per truck. Outbound rates increased for reefer loads originating in Los Angeles, Green Bay, Dallas, and Philadelphia, but rates declined in Twin Falls, Atlanta, and Elizabeth, NJ. Rates were affected by weather as well as year-end demand.

The national average rate rose 1¢ for flatbeds last week, to $1.92 per mile, despite a 1¢ decline in the fuel surcharge. The load-to-truck ratio got a big boost last week, from 7.5 to 11.4 loads per truck, mostly because truckers were more likely than freight brokers to take vacation during the week between Christmas and New Year’s Day. Outbound rates increased for flatbed loads originating in Las Vegas, Rock Island, Houston, Oklahoma City, Atlanta, and Pittsburgh, but rates declined in Los Angeles, Dallas,Tampa, and Baltimore.
Demand and capacity information is based on load and truck posts from DAT Load Boards. Rates are derived from DAT RateView and are based on actual rate agreements between freight brokers and carriers. Reference rates include fuel surcharges but not accessorial or other fees.


