The U.S. Bank National Shipment and Spend Indexes both posted gains during the final quarter of 2020, which is a reflection of strong demand in the e-commerce, retail and single-family home construction.
As we’ve been reporting in recent months, there have been winners and losers during the economic recovery, with freight in sectors like manufacturing and energy remaining lower in the last quarter.
The Shipment Index for Q4 included the first year-over-year increase since Q3 2019. The report noted, “every region posted year-over-year gains in spending as a result of improved volumes and rising rates. The Southeast continued its strong performance during the fourth quarter and was by far the best region for all of 2020.”
Find dry van loads and trucks on the largest on-demand freight exchange in North America.
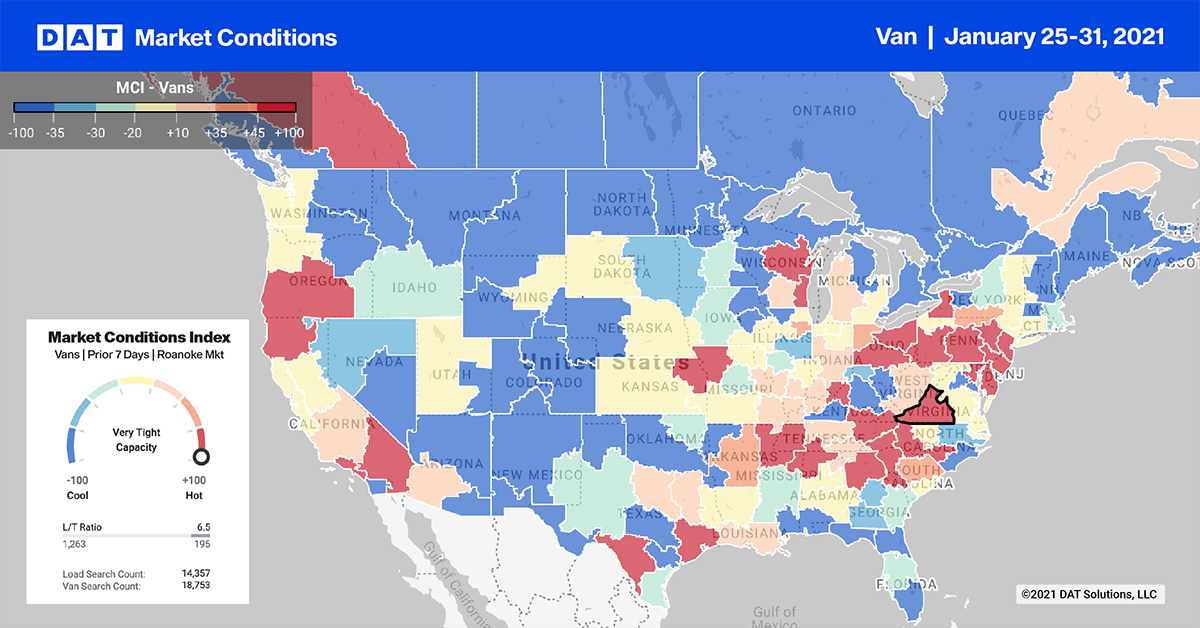
Dry van load posts increased by 17% w/w in the top 10 markets last week, but available capacity continued to loosen, with rates dropping $0.03/mile last week.
Import volumes through the Port of New York and New Jersey have been on the rise for the last four months, which is why the Elizabeth, NJ, freight market retained the number one position for outbound load posts after an 8% w/w increase last week. Capacity remained flat, with rates remaining unchanged at $1.87/mile excluding FSC and as low as $1.34/mile for westbound loads to Los Angeles.
Further south down Interstate 95 in Atlanta (No. 3), outbound rates dropped $0.04/mile to $1.85/mile, even though volumes increased by 5% w/w.
West Coast markets jumped back into the top 10 last week with outbound volumes in Ontario, CA, increasing by 59% w/w and by 52% w/w in Los Angeles. Rates dropped by $0.07/mile in both markets, though, which is a sign available capacity continues to loosen in the spot market.
Three-day average rates in both markets continue to plummet and are now down to $1.91/mile excluding FSC on the busy Los Angeles to Dallas lane, a whopping $1.18/mile decline since the peak in November. A similar story is evident on the high-volume Los Angeles to Chicago lane, where spot rates have dropped $1.07/mile since November to $1.81/mile excl. FSC.
Spot rates
The recent slide in spot rates was halted last week, as shippers cleared their docks to meet end-of-month commitments and deliver ahead of Winter Storm Olena. Spot rates remained largely unchanged and ended the week where they started at $2.05/mile excluding FSC. Dry van rates are still $0.53/mile higher than the same week in 2020.
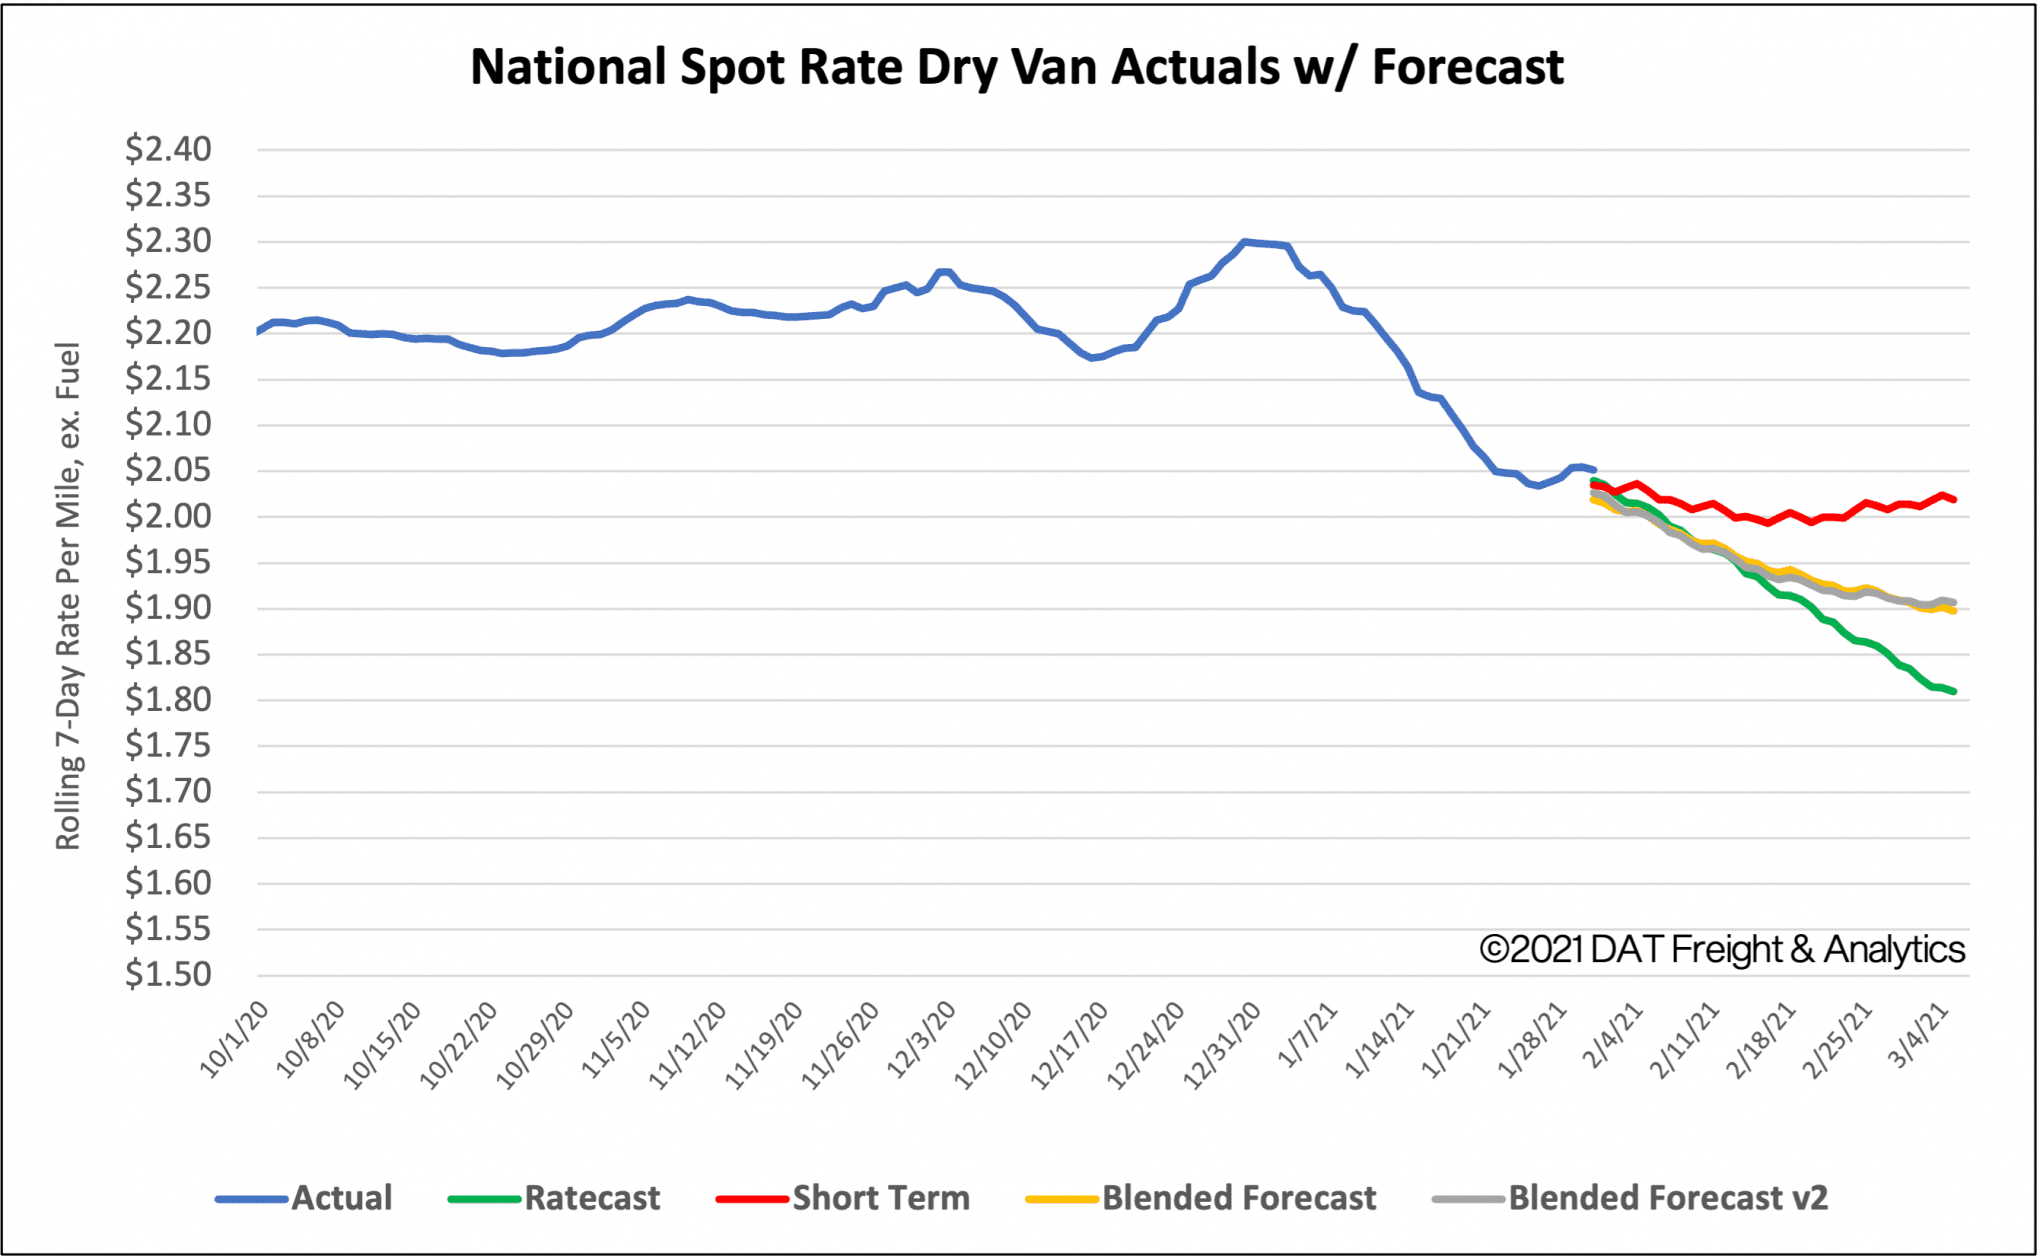
How to interpret the rate forecast
1. Ratecast Prediction: DAT’s core forecasting model estimate showing continued optimism and rate growth.
2. Short Term Scenario: Formerly the pessimistic model that focuses on a more near-term historical dataset.
3. Blended Scenario: More heavily weighted towards the longer-term models.
4. Blended Scenario v2: More heavily weighted towards the shorter-term models.
> Learn more about Ratecast predictions available in RateView.


