The fourth quarter is poised for strong demand for truckload freight, especially in the dry van sector. Persistent consumer demand is largely behind the recent National Retail Federation (NRF) forecast, which indicated that 2021 holiday retail sales during November and December will grow 8.5% to 10.5%.
Find loads and trucks on the largest load board network in North America.
Note: All rates exclude fuel unless otherwise noted.
Consumers are expected to spend between $843.4 billion and $859 billion this holiday season. Even on the low end of the forecast, that would be the largest total amount on record after eclipsing last year’s $777.3 billion in retail sales.
“There are several factors coming together to have a major impact on the holiday outlook, but household fundamentals are a bright spot in the uncertain present,” says Jack Kleinhenz, NRF Chief Economist. “Consumers are in a very favorable position going into the last months of the year and are spending because they can.”
Consumer confidence has been boosted this year following a record $2.5 trillion in accumulated savings by consumers who have largely stayed home rather than dine out or travel during the pandemic. For carriers and brokers, this is good news in the short term. However, beyond the holiday season spending frenzy when 2022 rolls around, we could see a sharper drop-off in demand to start the year — more so than we usually do.
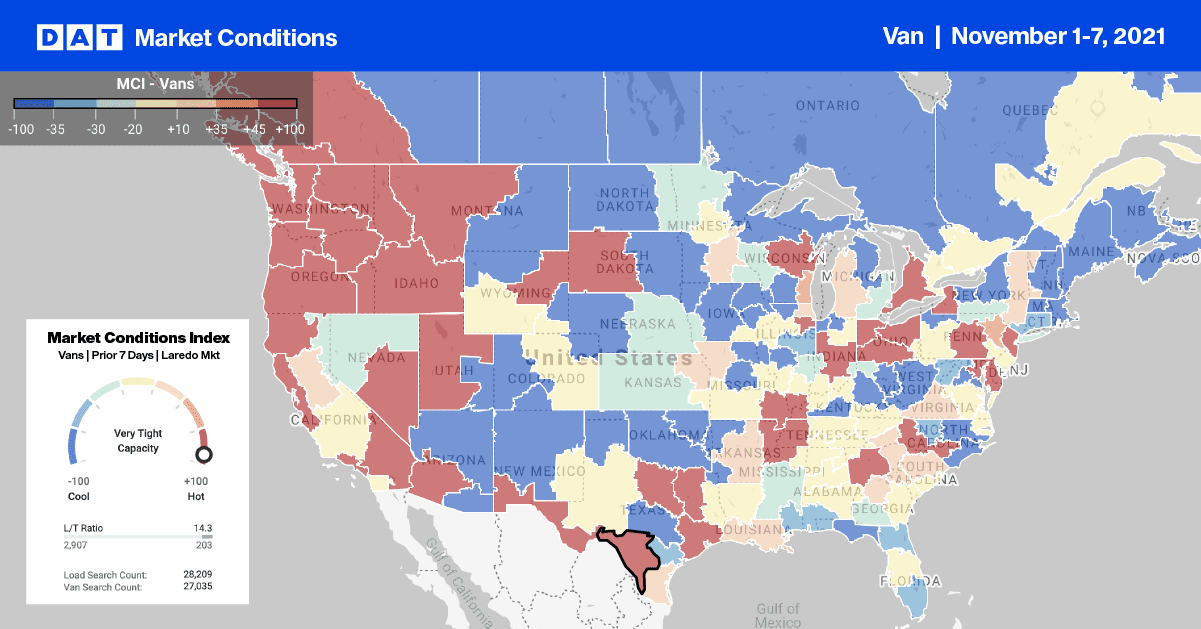
Capacity was very tight last week for inbound loads to Denver, but it remains a strong backhaul market. The volume of inbound loads moved were 25% higher than outbound loads last week. Load post volumes were down 20% last week for outbound loads and 18% for inbound loads. This set up a scenario where carriers were looking for higher rates for inbound loads.
Outbound loads from Denver to Chicago also increased last week by $0.12/mile to an average of $1.34/mile.
From Los Angeles to Denver, spot rates jumped last week to $4.06/mile. This is the highest they’ve been in 12 months ($0.39/mile higher year-over-year).
The high-volume e-commerce Los Angeles to Phoenix lane shared the same trend. Rates are $0.23/mile above the October average at $4.73/mile.
Port Watch
As of the start of this week, there were a total of 72 container vessels at anchor off the coast of Los Angeles. This includes 31 physically anchored ships plus another 41 “loitering” further offshore. The ports of Long Beach and Los Angeles consider vessels within 40 miles of both ports to be “inport.”
There were a total of 29 container vessels at berth unloading, which is slightly above the long-term average of 28 vessels. The Port of Los Angeles reports that the average wait time at anchor is 14.6 days.
Spot rates
After declining for three weeks, dry van spot rates reversed course last week and increased by $0.06/mile to a national average of $2.54/mile. Spot rates are now 12% or $0.30/mile higher than this time last year.
Of our Top 100 lanes (for loads moved), spot rates:
- Increased on 44 lanes (compared to 21 the week prior)
- Remained neutral on 34 lanes (compared to 28)
- Decreased on 22 lanes (compared to 28)
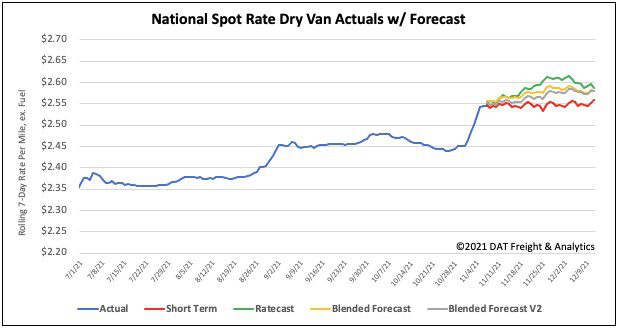
How to interpret the rate forecast:
- Ratecast: DAT’s core forecasting model
- Short Term Scenario: Formerly the pessimistic model that focuses on a more near-term historical dataset
- Blended Scenario: More heavily weighted towards the longer-term models
- Blended Scenario v2: More heavily weighted towards the shorter-term models


