Import volumes continue to surge ahead of the holiday retail season according to the latest data from IHS Markit. Containerized import volumes for July 2021 were up 20% compared to the same month last year and also up 7% since June.
In terms of TEU (twenty-foot equivalent unit) volume, importers brought in 441,387 more TEU containers this July compared to July 2020. This is the equivalent to approx 196,100 truckloads. The increased volume resulted in an additional 126,784 TEU’s, or the equivalent of 56,348 additional truckloads in port markets around the country.
Find loads and trucks on the largest load board network in North America.
Note: All rates exclude fuel unless otherwise noted.
The Port of Los Angeles maintained the number one position for total TEU volume with an 18% share of July volume. New York and the Port of Long Beach kept spots two and three, each with 15% of the month’s volume.
Of the top 10 ports, Long Beach recorded the largest sequential increase at 20%. It’s followed by Charleston at 15%. Savannah, Norfolk, Tacoma, Oakland all saw a 12% monthly increase.
Gulf Coast ports including New Orleans and Mobile were the only Top 10 ports to record sequential losses at -12% and -14% respectively.
Furniture remains the number import commodity accounting for around 15% of all TEU volume. On the West Coast (Los Angeles and Long Beach ports), furniture volumes are up 34% compared to the same time last year while Savannah on the East Coast saw a 49% increase in volume.
In July, there were 46,980 additional furniture TEU’s at these three ports alone compared to July 2020. This is the equivalent of approximately 21,000 additional truckloads.
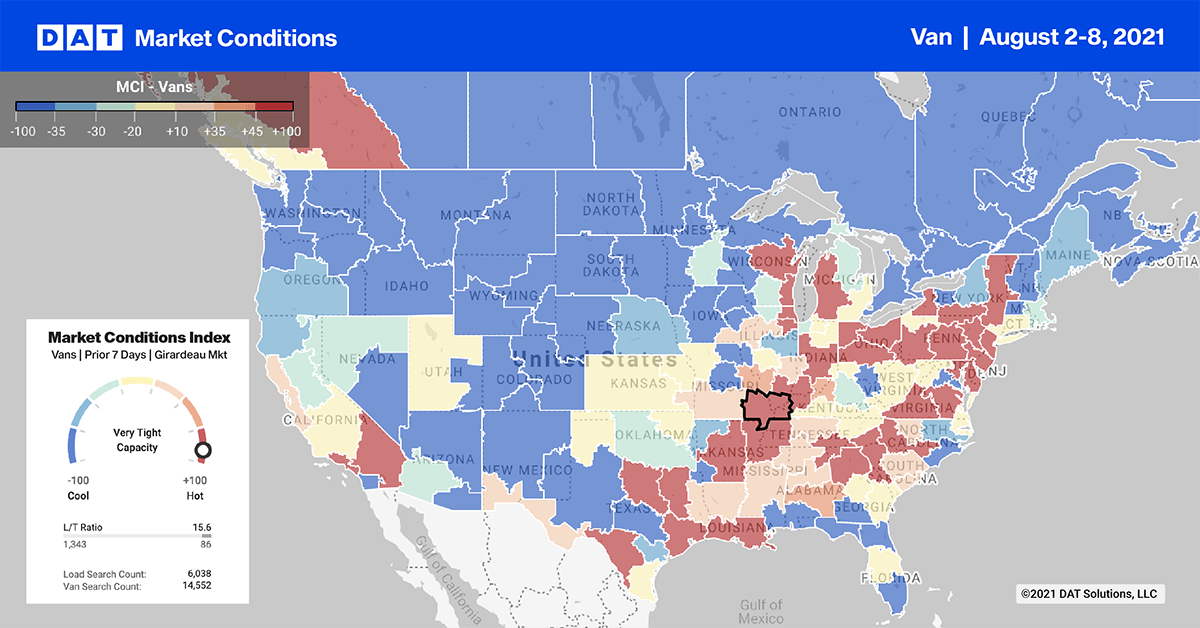
The intermodal congestion has put Chicago shippers into panic-mode, with spot rates increasing in many lanes last week:
- The 720-mile run from Chicago to Atlanta jumped by $0.41/mile over the July average to reach $3.32/mile.
- Chicago to Allentown, PA, lane, increased $0.06/mile to an average of $3.66/mile.
- Chicago to Harrisburg run, another capacity challenged intermodal lane, jumped $0.30/mile to an average of $4.11/mile.
- Chicago to the Northeast intermodal ramp in Worcester, MA, were up $0.03/mile to $3.25/mile.
- The 928-mile Chicago to Dallas lane went up $0.16/mile to $2.67/mile.
Spot rates
Dry van spot rates took a pause last week and remained flat at $2.43/mile after going against seasonal trends the week prior. Dry van rates are still $0.44/mile higher than this time last year and $0.62/mile higher than the same period in 2018. On our Top 100 lanes, spot rates were neutral on almost a third of the lanes, up on 29 (35 the week prior), and down on 37 (22 the week prior).
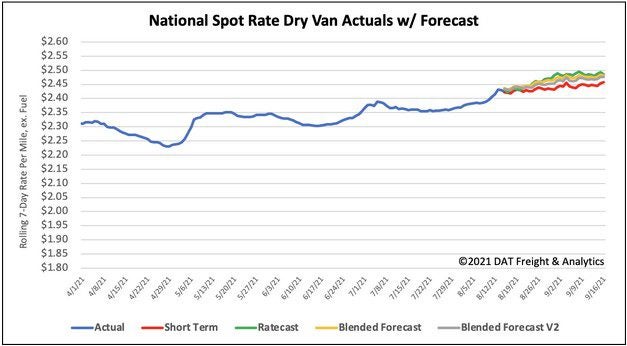
How to interpret the rate forecast:
- Ratecast: DAT’s core forecasting model
- Short Term Scenario: Formerly the pessimistic model that focuses on a more near-term historical dataset
- Blended Scenario: More heavily weighted towards the longer-term models
- Blended Scenario v2: More heavily weighted towards the shorter-term models