October was surprisingly quiet on the spot market. Typically, there is a surge of Christmas merchandise moving from the ports to retail distribution centers at this time of year, but inventories are high, and there is less seasonal freight on the road. Plus, contract carriers have become more efficient at handling exceptions to their scheduled freight movements, so shippers are not engaging with 3PLs and freight brokers to find spot market capacity as they did last year.
There are still some bright spots on the map, where lots of loads are being offered but there are not enough trucks available to move them in the right direction. That dynamic will put pressure on rates in those lanes, so a midrange price could become more attractive.
Here is the Hot Market report, for the past week and month, for the three major equipment types:

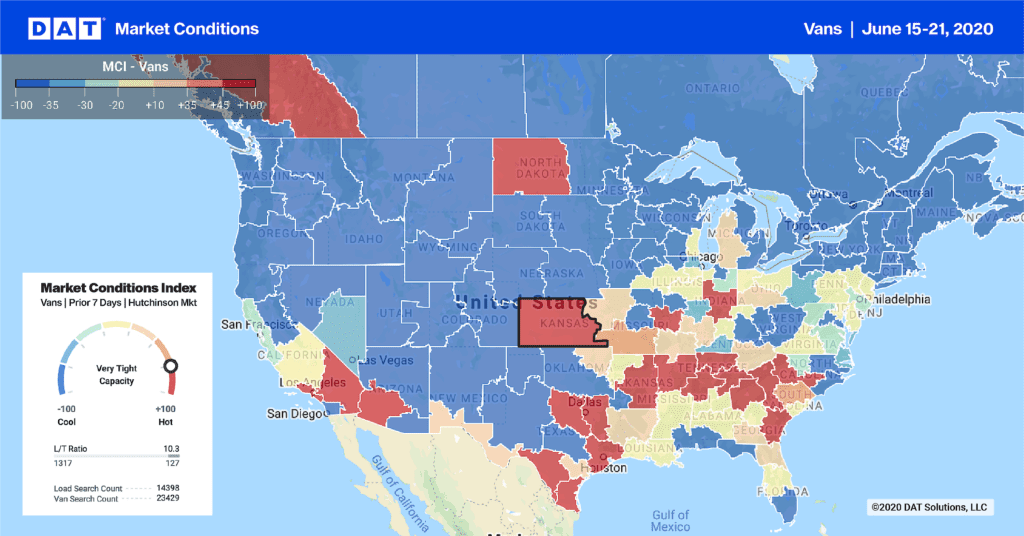
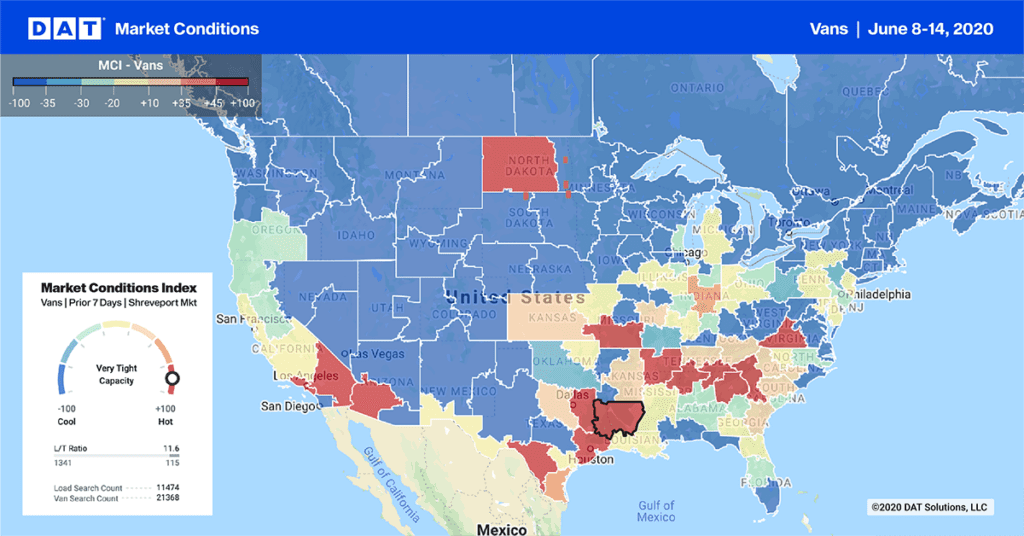
Van load availability on the spot market rose 8.4% last week, while truck posts on DAT Load Boards declined 2.2%. That pushed the national load-to-truck ratio up from 1.3 to 1.5 loads per truck. For the month of October, load posts were down 11% compared to September, but demand remained high in the Pacific Northwest agricultural markets of Medford, OR and Twin Falls, ID, as depicted in this Hot States Map for the week of Oct. 25-31. A relative shortage of trucks also led to higher ratios in the Dakotas, and in Missoula, MT, but demand there was more subdued.

Spot market rates were unchanged for flatbeds last week, despite a 7.8% increase in capacity that drove the load-to-truck ratio down 7.2%, to 8.5 loads per truck. That is an uncharacteristically low ratio for flatbeds, falling below 10 in October for the first time in three years. It’s a signal that rates are likely to drop again soon. The national average rate slipped 3¢ lower in October compared to September, to a national average of $2.00 per mile. Outbound rates lost traction in Houston, a historically strong flatbed market where rates were down 4¢ to an average of $2.05 per mile last week. Rates also declined in Atlanta, down 8¢ to $2.21, but outbound flatbeds got a 6¢ increase out of Los Angeles, to $2.32 per mile.

Reefer freight availability held steady last week, but the national average rate declined by 1¢, to $1.94 per mile. Compared to September, the load-to-truck ratio for reefers declined 18%, a common seasonal trend. Reefer demand remains robust in agricultural markets of the Upper Midwest, including Green Bay, WI, where outbound rates rose 10¢ last week to an average of $2.73 per mile.
Daily maps, along with detailed information on demand, capacity and rates for individual markets and lanes, are included in DAT Power Load Boards, and in DAT RateView, which is the source for up-to-date rate information on 65,000 lanes in the U.S. and Canada. Rates are based on actual rate agreements between freight brokers and carriers, including fuel surcharges but not accessorial or other fees. A weekly summary of spot market trends is found in DAT Trendlines.


