Imported volumes of fruit and vegetables are on the rise, with the vast majority (93%) of truckloads coming across the southern border. On our northern border, the most common commodity is potatoes used in the production of frozen French fries and potato chips.
Last week, potatoes accounted for 56% of all Canadian produce truckloads, with carrots a distant second, according to the USDA. Most of the potato volume comes from the Atlantic provinces, including Prince Edward Island, the number one potato producing province in Canada. About 40% of potato truckloads enter the U.S. in Maine at either the Houlton or Calais border crossings each week (39%) followed by Buffalo, NY; Pembina, ND; and Champlain, NY, each accounting for approximately 13% of truckloads each week.
On our southern border, the number one crop was tomatoes, accounting for 16% of truckloads last week, followed by avocados (12%) and cucumbers (8%). The number one crossing point for produce from Mexico was Nogales, AZ, with 29% of truckloads, but closely followed by Pharr, TX (28%).
Cucumbers, squash, peppers and tomatoes made up 76% of truckloads in Nogales. Farther east in the Rio Grande Valley, avocados and limes made up 31% of truckloads, followed by tomatoes at 15% and strawberries at 7. In California, Otay Mesa and Calexico border crossings accounted for 17% of truckload volume, with lettuce being the dominant commodity at 18% of volume followed by asparagus and onions at 9% each.
Find reefer loads and trucks on the largest load board in North America.
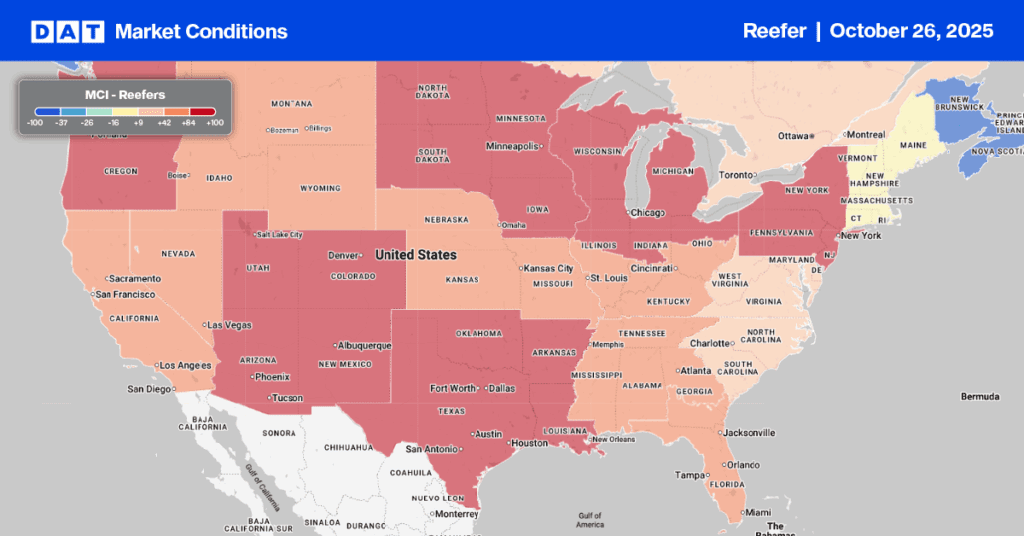
Reefer load post volumes dropped again by 13% w/w in the top 10 spot markets last week. Dallas was the only top 10 market with higher volumes. Capacity was not as tight this week, with reefer spot rates decreasing by $0.01/mile to $2.34/mile, excluding fuel.
Atlanta outbound volumes dropped 13%, with no change in rates at $2.67/mile. On the West Coast, capacity eased slightly in Los Angeles, with reefer volumes down 22% w/w and rates down $0.01/mile to $3.04/mile. A similar volume drop was recorded in nearby Ontario, CA, with no change in capacity or rates at $3.02/mile.
Capacity continues to tighten in southern Florida where produce season has started. Lakeland, FL, entered the top 10 last week, with rates up $0.02/mile to $1.92/mile. Miami rates were up $0.05/mile to $2.00/mile.
Spot rate forecasts
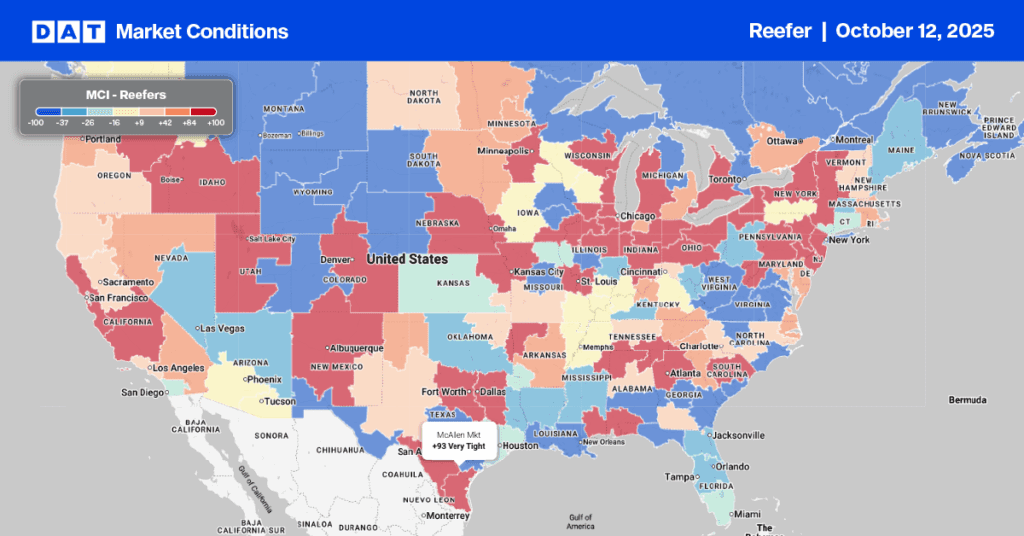
Spot rates in the reefer sector cooled last week dropping by 5 cents to $2.62/mile, excluding fuel. Compared to the same week in 2020, reefer spot rates are now $0.76/mile higher.
Colder weather in the upper half of the U.S. this week will keep demand for reefers elevated, as shippers add “protect from freeze” to bills of lading to prevent temperature-sensitive dry freight.
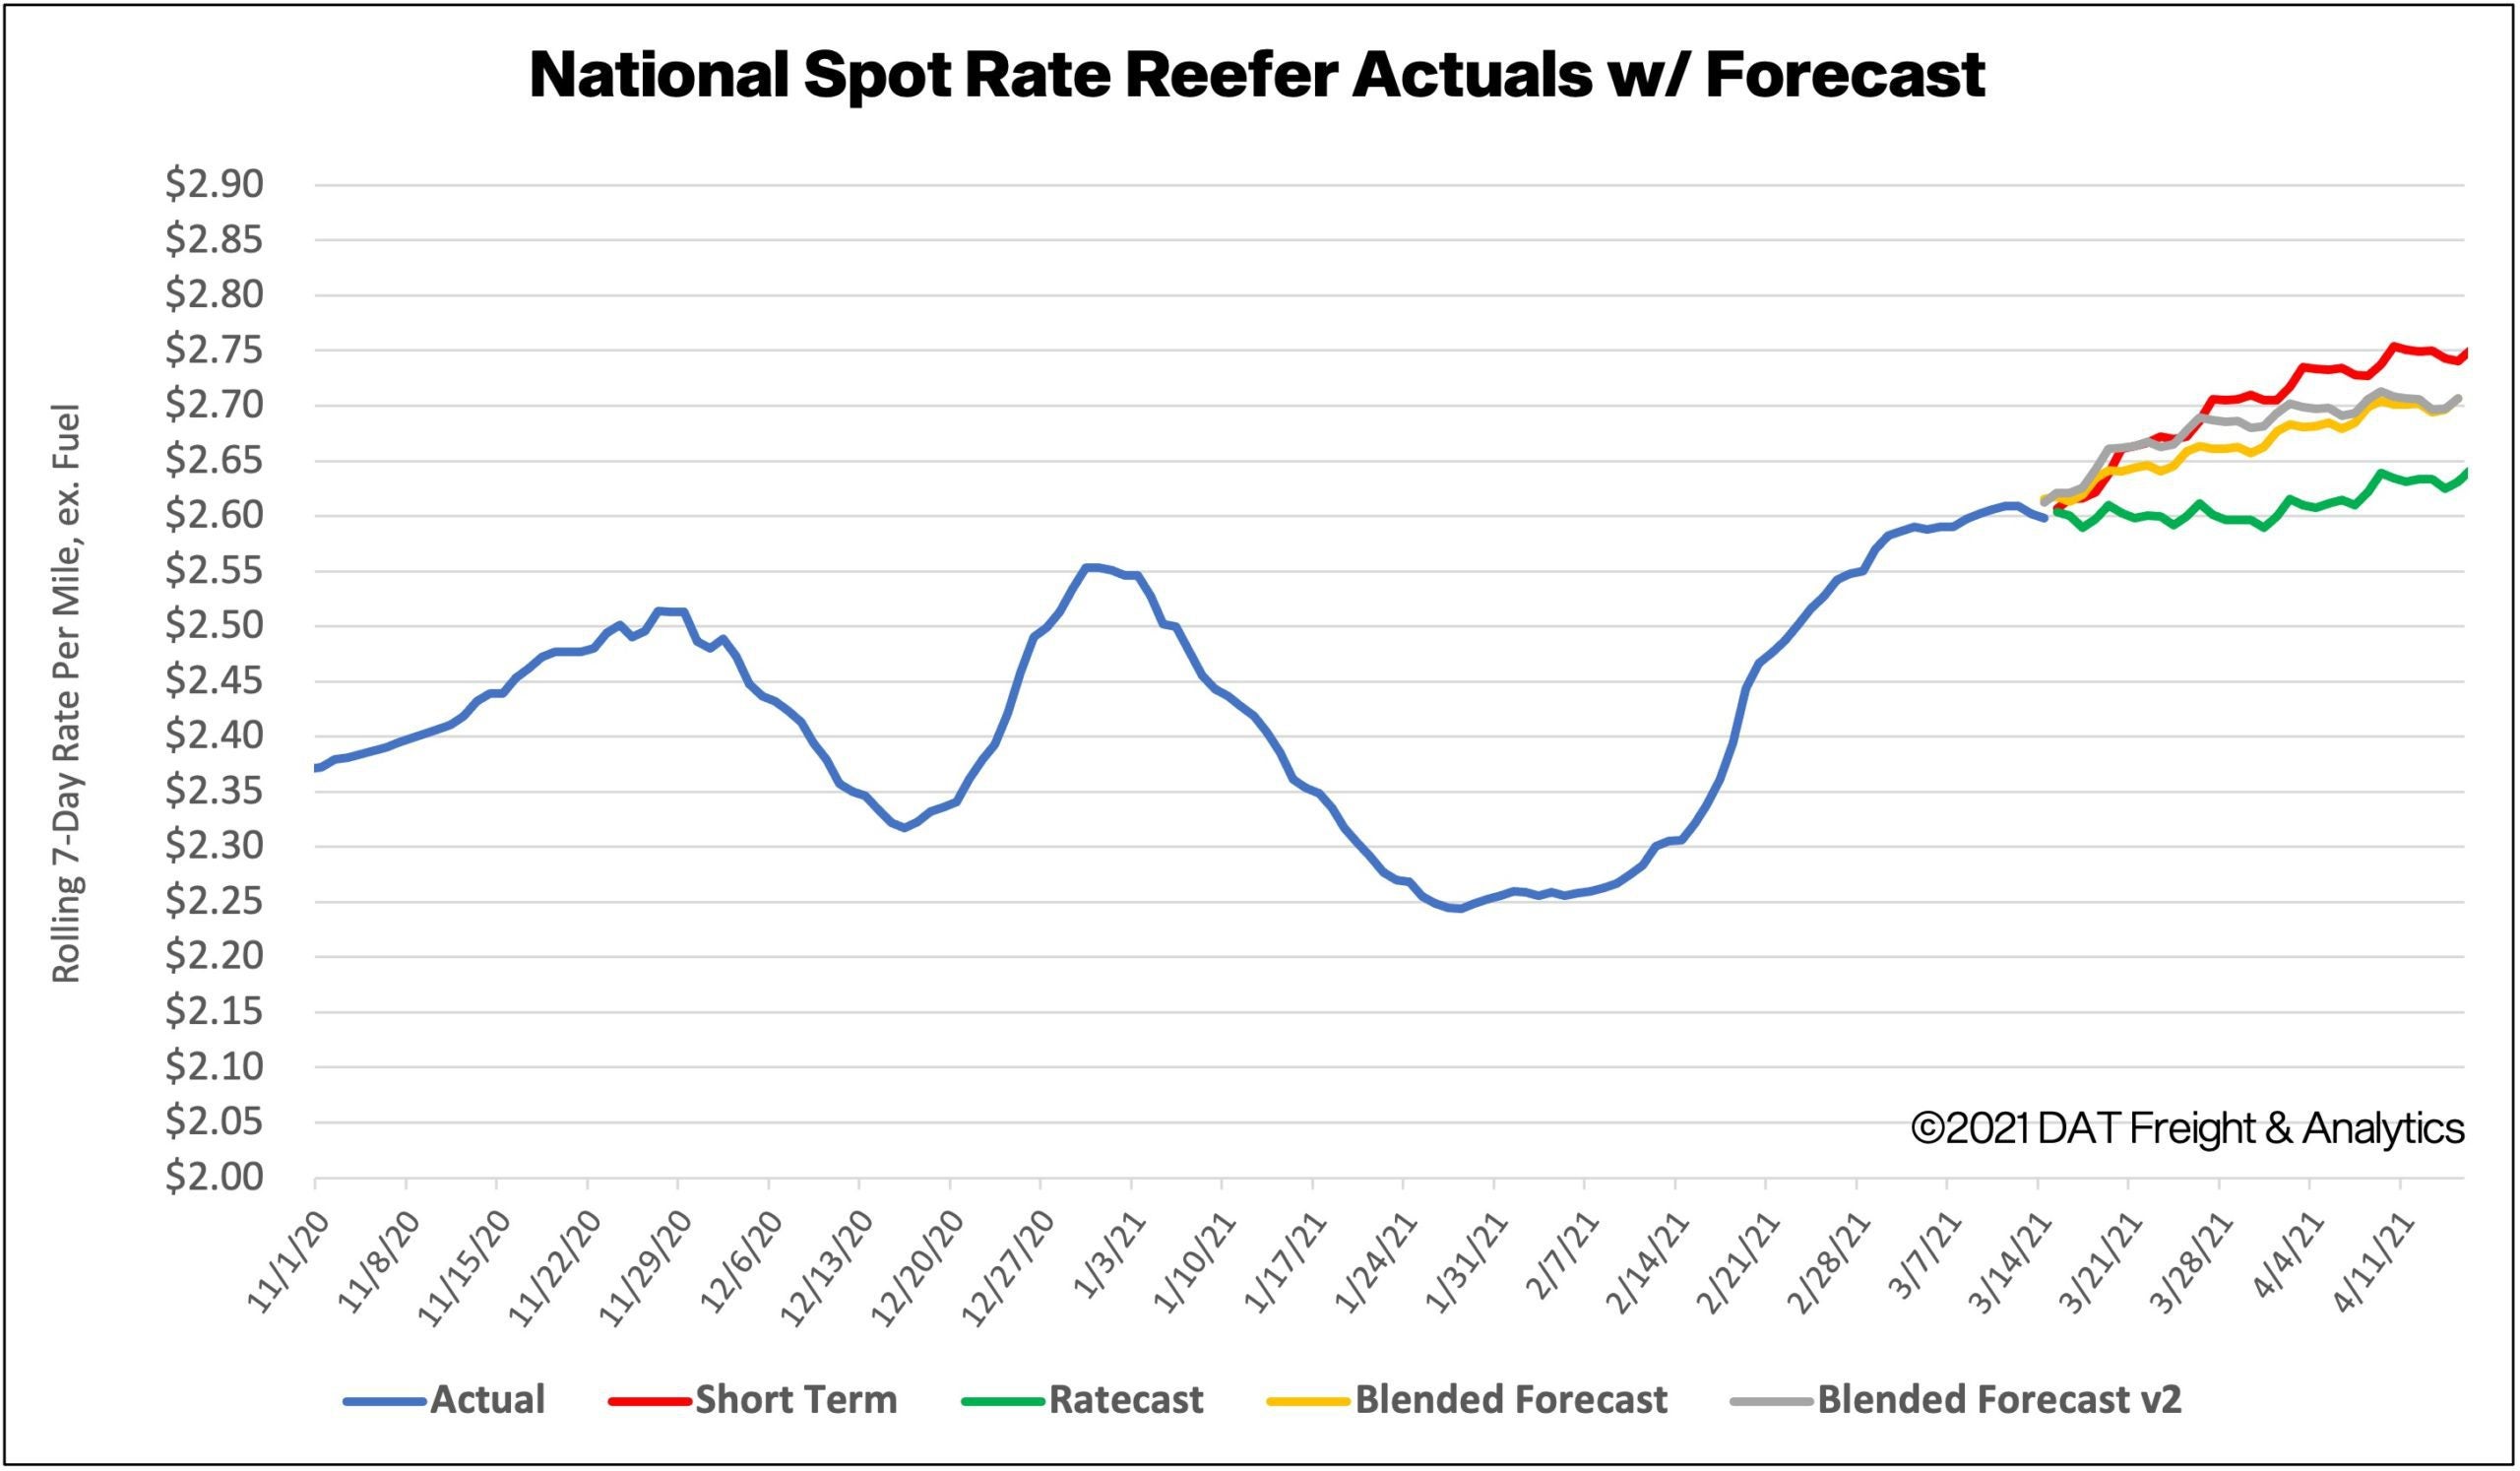
How to interpret the rate forecast:
- Ratecast: DAT’s core forecasting model
- Short Term Scenario: Formerly the pessimistic model that focuses on a more near-term historical dataset.
- Blended Scenario: More heavily weighted towards the longer-term models.
- Blended Scenario v2: More heavily weighted towards the shorter-term models.
> Learn more about rate forecasts from DAT iQ