The U.S. economy has been on a bit of a roll based on factors including demand, production, employment and public health. According to the Oxford Economics’ Recovery Tracker report, the U.S. economy posted its 18th consecutive weekly gain at the end of June. All five regions posted a synchronized gain, and 44 states posted a weekly increase.
But of course that was until the spread of the highly contagious Delta variant, which began to accelerate in July. What all of this means for flatbed carriers in terms of second-half demand remains uncertain. However, key sectors including steel production, agricultural machinery and building materials continue to perform well.
For the week ending August 7, the production of raw steel had increased by 27% year-over-year and up 19% year-to-date.
In the agricultural farm machinery sector, July sales volumes are still 20% higher than the five-year average for 2-4WD tractors. According to the Association of Equipment Manufacturers’ (AEM) July report, total farm tractor sales are up 13.7% since the beginning of the year with sales of an additional 23,773 tractors being sold compared to the first eight months of 2020.
For flatbed and specialized carriers that’s the equivalent of an estimated 12,000 additional truckloads this year (assuming 2 x 2WD tractors per load).
Last week’s new housing construction data indicates the market is cooling as a result of surging construction costs and home prices. Unrelenting supply chain constraints resulted in new housing starts dropping 7% in July compared to June. Building permits also fell by 2.6%.
Find loads and trucks on the largest load board network in North America.
Note: All rates exclude fuel unless otherwise noted.
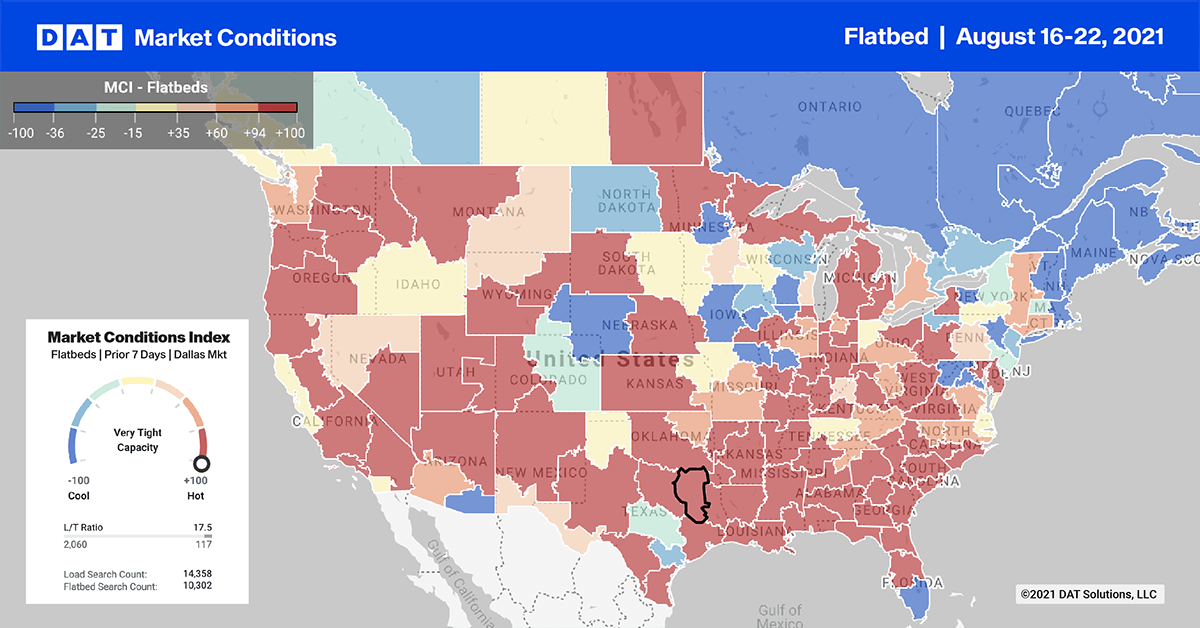
In the lumber-rich Pacific Northwest, including the Seattle and Portland markets, outbound spot volumes spiked last week. Volumes increased by 44% last week to be up an amazing 72% month-over-month. As a result, spot rates jumped by $0.46/mile last week to an average outbound rate of $3.08/mile.
On individual lanes, the results were mixed though last week:
- Seattle to Stockton, rates were down $0.23/mile below the July average to $1.94/mile last week
- Portland to Stockton, spot rates jumped $0.47/mile to $2.51/mile
- Spot rates for loads east to St Cloud, MN were up $0.10/mile to an average of $1.78/mile
Load post volumes almost doubled out of the Ontario market last week, with neighboring Fresno as the most popular destination. Shippers and brokers had no trouble with capacity as spot rates on that lane ended last week at $3.15/mile, which was $0.27/mile below the average for July.
Spot rates
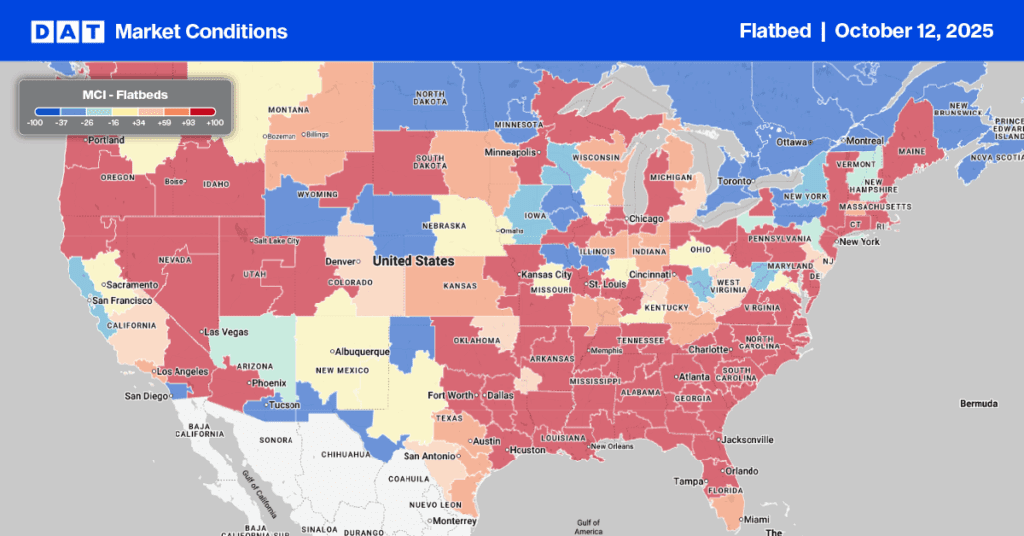
Flatbed spot rates have now decreased for the seventh week in a row following last week’s drop of $0.03/mile to an average national rate of $2.62/mile. Flatbed spot rates remain $0.55/mile higher than the same week last year and $0.38/mile higher than the same time in 2018.
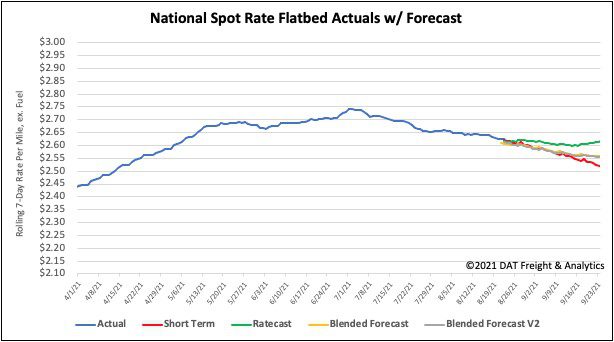
How to interpret the rate forecast:
- Ratecast: DAT’s core forecasting model
- Short Term Scenario: Formerly the pessimistic model that focuses on a more near-term historical dataset
- Blended Scenario: More heavily weighted towards the longer-term models
- Blended Scenario v2: More heavily weighted towards the shorter-term models