As more and more cities and states institute measures in response to the COVID-19 threat, consumers have rushed to grocery stores to stock up for extended time at home. Store shelves are bare, but the truckload spot market is already mobilizing to meet the surge in demand.
The spike in consumer purchases, plus a mix of seasonal produce shipments, has boosted reefer rates higher across the country.
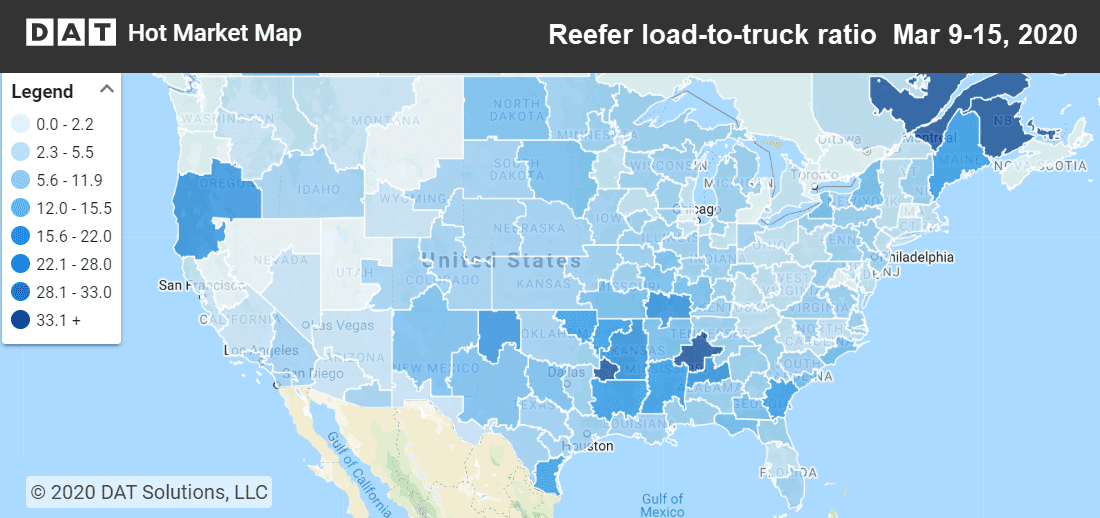
Reefer demand exceeded supply in parts of the Southeast last week, as shown by the dark areas of the Hot Market Map. Demand and ratios rose sharply for eastbound trucks leaving California and the Upper Mountain States, as well. Load-to-truck ratios in those areas were low to start the week, so they don’t appear to be high compared to other parts of the country. Hot Market Maps are found in DAT RateView and DAT Power.
Location, location, location
It’s as true for transportation as it is for real estate: Location is the most important element in determining the price. Unlike real estate, transportation also has a direction, and that’s the next most important part of the pricing equation.
While the national average load-to-truck ratio soared to 6.2 loads per truck from 4.6 in the previous week, most of the imbalance originated in California and the Upper Mountain States. Rates rose from West to East. At the same time, there’s also an ongoing seasonal trend of rising rates on lanes from South to North, as trucks haul fresh fruit and vegetables, as well as packaged frozen and refrigerated foods, from producers to consumers.
- Tucson to New York City rose 18¢ to $2.20 per loaded mile, but New York to Tucson? Fuggedaboutit. There aren’t many loads, at an average of $1.85.
- Ontario, CA to Stockton, CA, gained 9¢ to $2.61, and Stockton to Ontario added 2¢ to $2.10,
- Dallas to Houston rose 9¢ to $2.61, as well, and Houston to Dallas lost a few cents to $2.68 per loaded mile. You could do worse.
- Lakeland, FL, to Baltimore was up 6¢ to $1.82. Baltimore to Lakeland held steady at a $2.15 average, but there aren’t a lot of loads in that direction.
- McAllen, TX to Elizabeth, NJ, added 7¢ to $2.18, and Elizabeth to McAllen had hardly any loads, even for $1.26 per mile. Look for a TriHaul.
- Atlanta to Philadelphia paid $2.27, up 7¢, and Philly to Atlanta rates rose 5¢ to $2.07 per loaded mile.
On the flip side, fewer than a dozen of the top 72 reefer lanes paid less last week than they did the week before.
- Denver to Stockton, CA, lost 4¢ to $1.53, and Stockton to Denver paid $2.30 per mile, up 3¢ from the previous week.
- Twin Falls, ID, to Phoenix fell 8¢ to $2.10. Phoenix to Twin Falls paid an average of $2.53 to a few truckers who could find a load.
- Green Bay, WI, to Joliet, IL, also dropped 8¢ to $3.28 per loaded mile, and Joliet to Green Bay plummeted 27¢ to $2.62 per mile.
It would take more than a day to complete that last 470-mile roundtrip unless all the planets are aligned in your favor. If it works with your schedule, and you can find the loads, that’s a pretty good rate per mile.
These rates represent 7-day averages for the week ending March 15, and they can change very quickly as market conditions evolve. Be ready to negotiate, and keep an eye on DAT RateView and DAT Power for emerging trends in the markets and lanes that matter to your business.
RELATED: Van Rate Trend: COVID-19 uncertainty spurs truckload rate increases