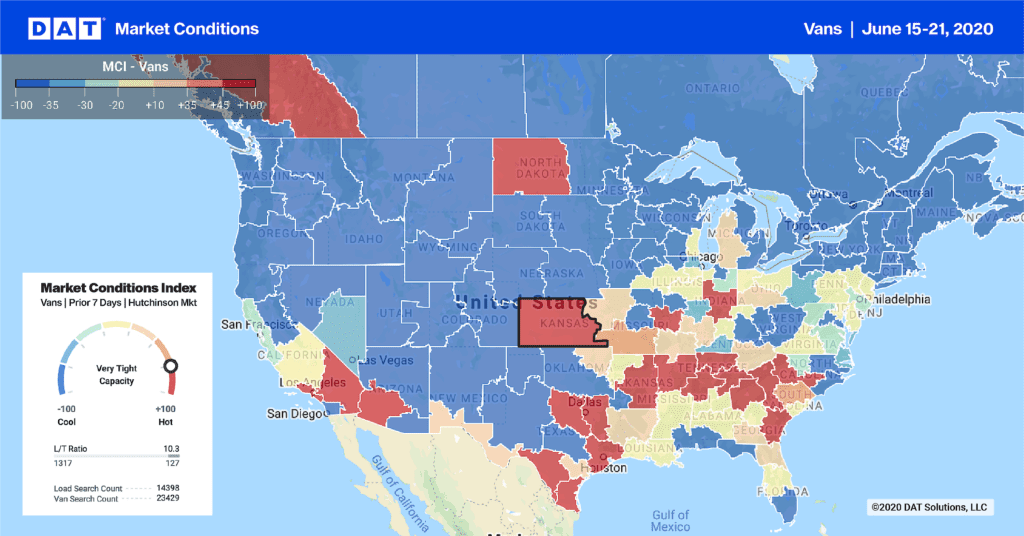
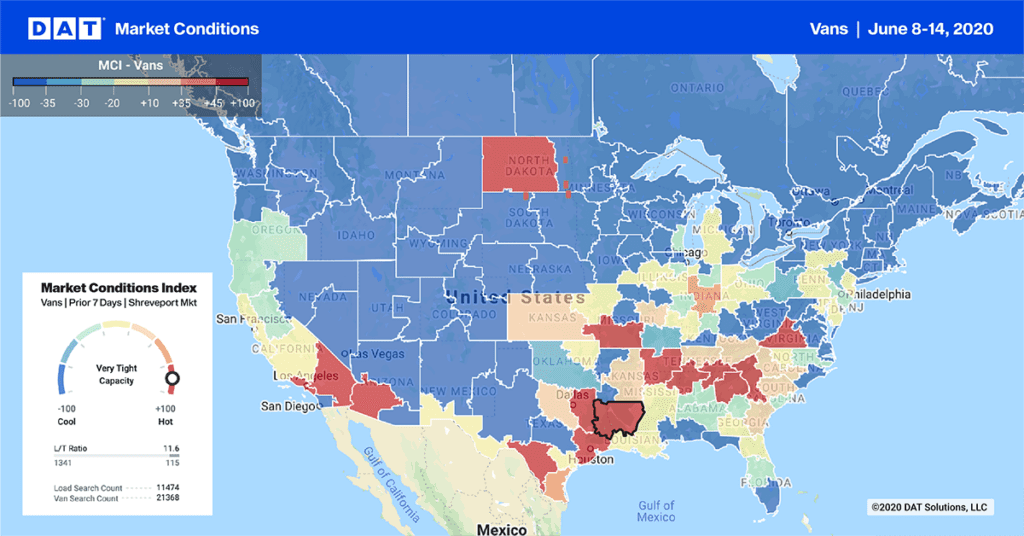
It’s normal for spot market rates and volumes to slip this time of year, but loads posted to DAT load boards were only down 3% last week. Truck posts edged up 2%, so load-to-truck ratios fell, but spot market demand is still strong. Rates were also down, but the national averages for vans and flatbeds remain higher than the June averages.

Van rates on most of the top 100 van lanes were down last week. Again, that’s a typical trend this late into July, but we’re coming off of some of the highest prices we’ve seen in years, so rates are still unusually strong. Demand slipped, but only a little bit, so volumes on the top 100 lanes are still high, even if they don’t match the record-breaking levels of two weeks ago.
Charlotte and Los Angeles continue to have the highest outbound van rates, while Atlanta remains number one for load volume.
RISING LANES
Rates were down in most places, but less so in the Midwest and West than in other regions. A couple of westbound, long-haul lanes jumped up in price:
- Denver to Stockton, CA rose 20¢ to $1.26 per mile, which is still a low rate, but that’s the highest it’s been all summer
- Chicago to Los Angeles was up 13¢ to an average of $1.32 per mile, which offset a 10¢ decline in the headhaul rate from L.A. to Chicago
FALLING LANES
Retail activity slowed after a busy first half of the month, so rates fell on lanes heading into populations centers in the Northeast.
- Columbus to Buffalo fell 21¢ to $2.62 per mile
- Chicago to Allentown, PA dropped 17¢ to $2.36 per mile
- Regionally, the lane from Philadelphia to Boston declined 24¢ to $3.35 per mile
- And in the Southeast, Atlanta to Charlotte lost 20¢ to $2.47 per mile

Reefer trends mostly mirrored van, with rates and volumes down last week. Many crops haven’t quite hit the mark this year, or in some cases — grapes, for example — harvests are delayed. That could still be affecting load counts out of California, though there were decent levels of activity out of the central part of the state last week.
Things are looking up out of Grand Rapids, MI. Apple harvests are getting underway, and the early varieties have been shipping. Cucumbers and blueberries were the top crops for July, until now.
RISING LANES
The lanes with the biggest increases were mostly in the Midwest
- Green Bay to Minneapolis spiked 57¢ to $3.12 per mile
- Grand Rapids to Atlanta also jumped up 27¢ to $2.47 per mile
- Chicago to Philadelphia gained 22¢ to $2.78 per mile
- One California lane did join the top gainers: Ontario to Phoenix rose 24¢ to $3.19 per mile
FALLING LANES
Florida continued to slide, and higher volumes out of Denver led to some lower inbound rates.
- Los Angeles to Denver dropped 29¢ to $2.63 per mile
- Green Bay to Joliet, IL had the biggest decline, falling 49¢ to $3.12 per mile
A couple examples of falling Florida prices:
- Lakeland to Charlotte was down 28¢ to just $1.13 per mile, which is about as low as that lane has been in a year
- Miami to Elizabeth, NJ dropped 32¢ to $1.58 per mile

As we were saying before, Charlotte still has some of the best outbound rates in the country, but that also means that the inbound rates on certain lanes can get pretty low. For example, loads from Charlotte to Philadelphia averaged $2.75 per mile last week, but the backhaul only fetched $1.35. You can put together a TriHaul that sends your truck in the headhaul direction, for higher rates on the way back. With a subscription to DAT TruckersEdge Pro, carriers can now get automatic suggestions for higher-paying TriHaul routes, every time you search for loads.
Instead of heading straight back to Charlotte, you can make an extra drop and pick in Norfolk, VA. The Philly to Norfolk lane paid $2.30 per mile on average last week, and Norfolk to Charlotte averaged $2.53 per mile. The TriHaul would boost your average rate per loaded mile from $2.05 to $2.53 while adding less than 100 loaded miles to the route. If this fits with your Hours of Service and other commitments, it works out to an extra $732 for the total trip.
Find loads, trucks and lane-by-lane rate information in DAT load boards, including rates from DAT RateView.


