Despite an increase in freight volumes, national average rates slipped again last week for vans and reefers. Even the arrival of produce season in several southern markets wasn’t enough to boost national averages.
Weather was a factor, with snowstorms affecting a large swath of the country’s mid-section last week, from Colorado to the Upper Midwest and beyond. We’re also seeing the effects of extra capacity from the record numbers of tractors and trailers ordered last fall.
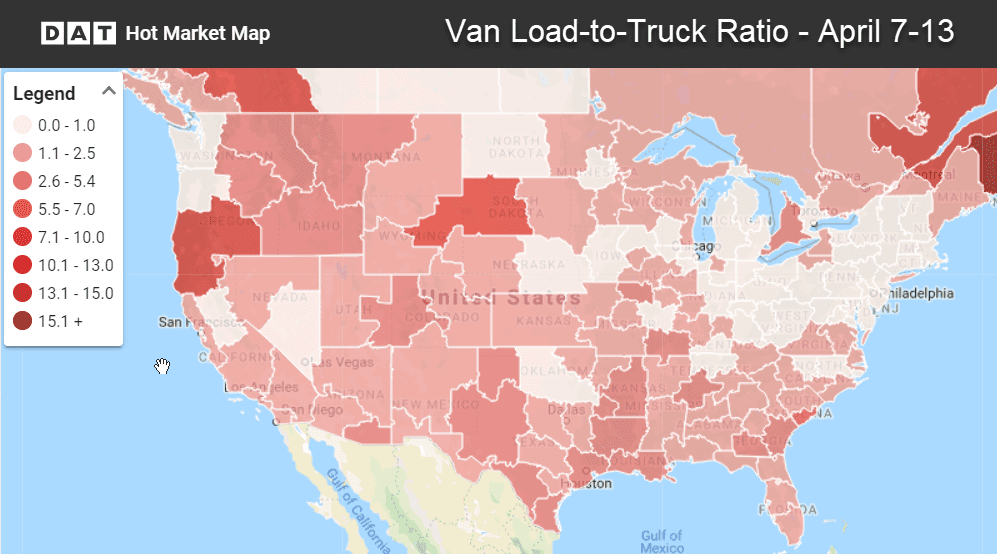
The van load-to-truck ratio declined last week to 1.3 loads per truck.
National Average Freight Rates – April to-date
- Van: $1.83/mile (2¢ lower than the March average)
- Reefer: $2.15/mile (2¢ lower than the March average)
- Flatbed: $2.37/mile (3¢ higher than March)
VAN TRENDS
Load counts rose nearly 5% in Chicago and Houston, and more than 3% in the number one van market, Los Angeles. But the news wasn’t all good for volumes. The snowstorm that hit Denver caused volumes to plunge there. Out East, Philadelphia also experience bad weather and saw load counts decline steeply. In the top 100 van lanes last week, prices rose in only 23 lanes, while rates fell on 76 lanes and 1 stayed neutral.
Rising rates
- Stockton to Denver increased 10¢ to $2.08/mi. (This rate isn’t great and likely reflected reluctance to drive to Denver in heavy snow)
- Buffalo to Charlotte also gained 10¢, rising to $2.13/mi. (It’s odd to see a Northeast-to-Southeast lane climb during April)
Falling rates
- Charlotte to Allentown moved down 13¢ to $2.08/mi. (The Carolinas have lacked pricing power since hurricanes last fall)
- Columbus to Buffalo fell 19¢ to $2.66/mi.
- Chicago to Buffalo also fell 19¢ to $2.31/mi. (It’s odd to see these two lanes into Buffalo falling in April)
REEFER TRENDS
Big advances in Florida and modest gains in California were wiped out by losses in volumes from the Upper Midwest and Texas. The end result was that the national rate average slipped, even as spring produce season is picking up. On the top 72 reefer lanes last week, slightly more lanes saw rising prices vs. falling prices, with 38 up, 31 down, and 3 neutral. Demand for reefers is likely to increase this week as Easter approaches.
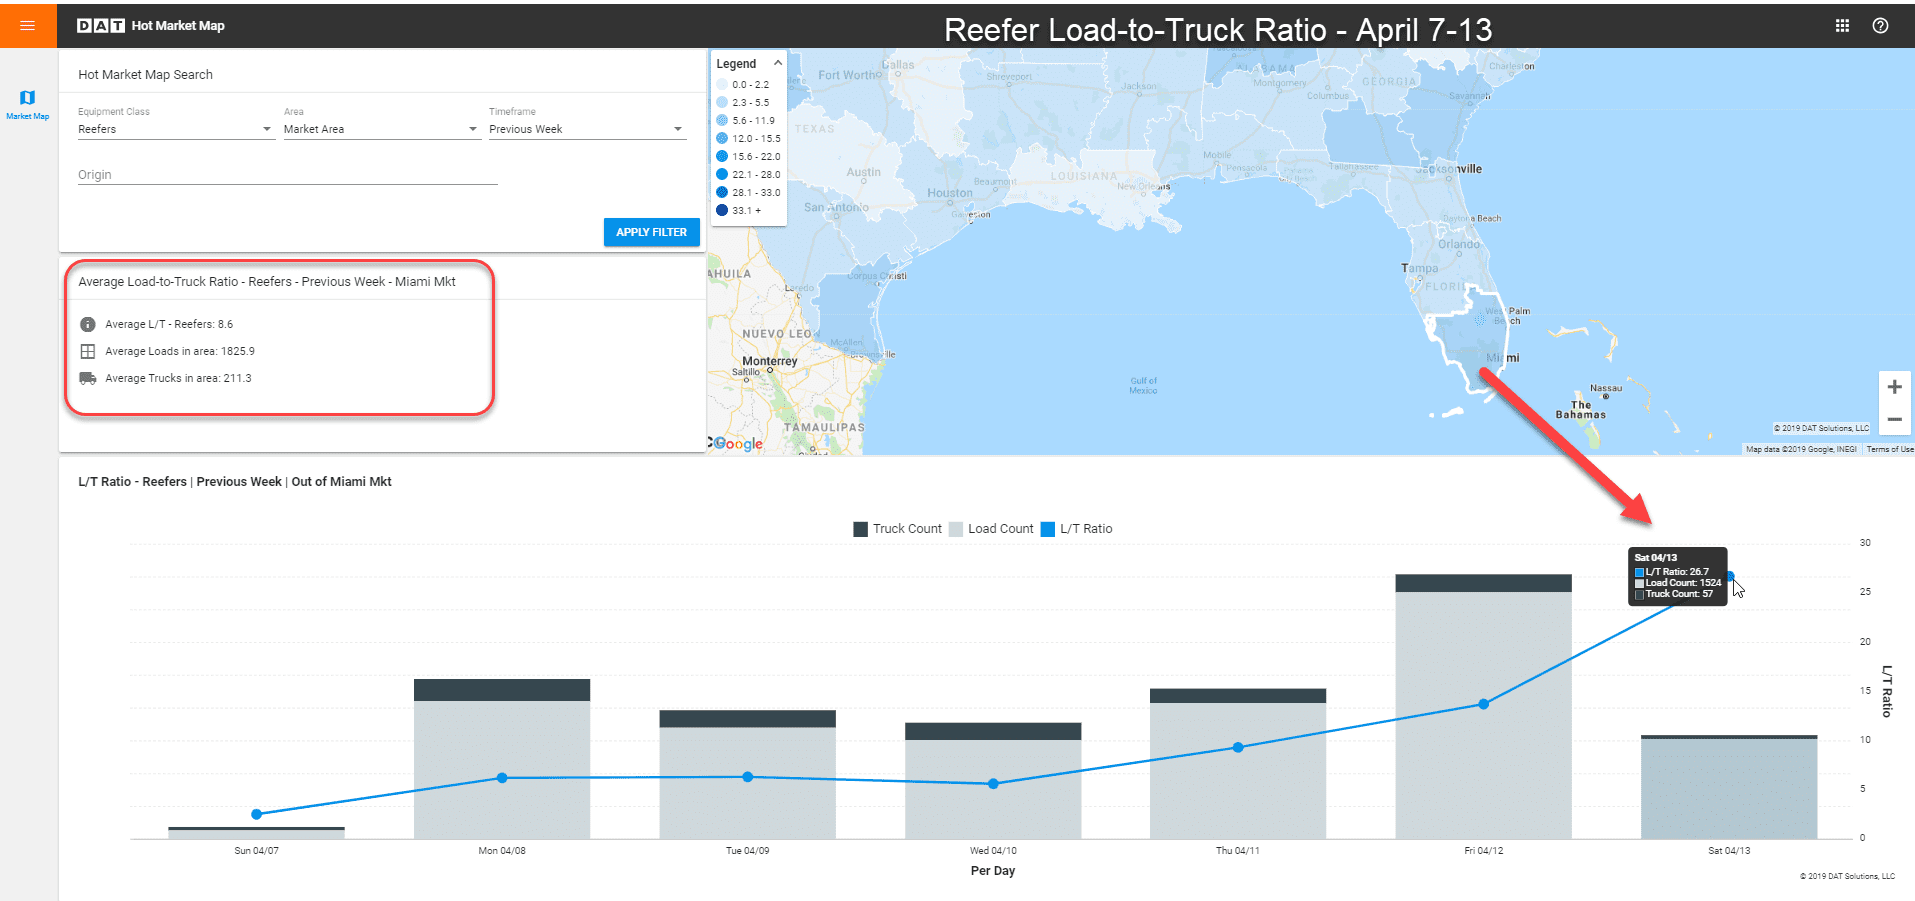
The load-to-truck ratio in the Miami market grew steadily last week, and hit 26.7 on Saturday. The average load-to-truck ratio for the week was 8.6, with 1,825 load posts on DAT load boards and only 211 truck posts. See how you can view similar maps and graphs using DAT’s Hot Market Maps.
Rising Rates
Freight volumes were up more than 20% in the Lakeland, Florida market, as well as in Sacramento and Fresno, California.
- Fresno to Denver surged 40¢ to $2.24/mi.
- Fresno to Boston gained 19¢ to $2.23/mi.
- Miami to Baltimore jumped 29¢ to $2.00/mi.
- Miami to Elizabeth, NJ rose 15¢ to $1.82/mi.
- Nogales, AZ to Chicago increased 15¢ to $1.93/mi.
Falling rates
The Ontario, CA market has been underperforming for this time of year, and last week both volumes and rates fell.
- Elizabeth, NJ to Boston dropped 31¢ to $3.77/mi.
- Philadelphia to Miami lost 15¢ to $1.72/mi.
- Grand Rapids, MI to Atlanta, GA fell 15¢ to $2.80/mi.
Find loads, trucks and lane-by-lane rate information in DAT load boards, including rates from DAT RateView.


