During the freight market cycle that began late 2017 and lasted well into 2018, many experts described capacity in 2018 as “the tightest in a decade.” And they were right. Then 2020 came and the pandemic hit, resulting in an even tighter capacity in the current freight cycle.
Get the clearest, most accurate view of the truckload marketplace with data from DAT iQ.
Tune into DAT iQ Live, live on YouTube or LinkedIn, 10am ET every Tuesday.
It’s hard to ignore how similar the two freight cycles are on paper despite being driven by two completely different economies. So, let’s explore the reason why they look so much alike and answer one of the more common questions we get each week on the DAT iQ Market Update show.
DAT’s flatbed load-to-truck ratio (LTR) is the best place to start. For those new to the subject, let’s first quickly explain what LTR is measuring. Load-to-truck ratios represent the number of loads divided by the number of trucks posted on DAT Load Boards.
The load-to-truck ratio is a sensitive, real-time indicator of the balance between spot market demand and capacity. Changes in the ratio often signal spot rate changes.
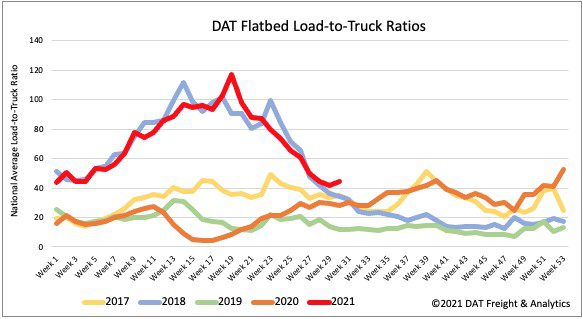
In DAT’s most recent flatbed LTR chart above, you’ll see how the 2021 LTR trend line (in red) tracks almost identically to the 2018 LTR (in blue) with a few exceptions.
The spike in the flatbed LTR in week 19 corresponds to both increasing demand and International Roadcheck Week held in early May. Roadcheck Week resulted in an acute flatbed capacity crunch as carriers took time off that week, driving up the LTR to its highest ever reading of 117.13 loads-per truck.
In 2018 we saw two similar spikes in the LTR. One corresponds to Easter plus the ELD (electronic logging device) hard mandate in week 14 of 2018. The other spike happened during Memorial Day in week 23. Both spikes saw drivers take time off and reduce truck post levels.
What drove the 2018 freight economy?
There were a few reasons behind the 2018 flatbed rate rally and capacity crunch:
- There was a strong uptick in building material shipments in late 2017 following Hurricanes Harvey and Irma. This drove up flatbed demand in the South Region leading into 2018.
- Changes in the 2018 corporate tax code stimulated spending in the industrial economy, which boosted demand for flatbeds.
- There was an oil drilling frenzy that created a lot of activity in fracking and demand for flatbed carriers to haul drill pipe, casing and other related oilfield materials.
According to the Baker Hughes Rig Count weekly report, the number of rigs drilling for oil increased 51% from the start of 2017 to the middle of 2018. This drove demand for flatbeds with spot rates peaking mid-year.
The crude oil price rally followed the frenzy of drilling activity. The price of West Texas Intermediate (WTI) crude increased by 50%, jumping from $45/barrel in June 2017 to $68/barrel a year later.
So why is the flatbed LTR in 2018 so similar to 2021?
The similarities in the flatbed LTR are more a result of the convergence of two entirely different processes at the same time of the year in 2018 and 2021. While 2018 was an industrial driven economy, 2021 is a consumer driven one.
This year we also had a massive disruption created by the February Polar Vortex event. It caused an acute capacity crunch and created a huge backlog of activity that took March, April and May to correct.
At the same time, we’ve been experiencing a pandemic-driven housing boom resulting in 1.57 million new single-family homes being built in the first half of this year. At around five truckloads of lumber alone per new home, that’s a lot of freight for flatbed carriers to haul at a time when drivers are also in short supply.
That’s why the flatbed LTR looks so similar despite the obvious and different economic conditions.