The recently released U.S. Bank Freight Payment Index reported growth, albeit at a slightly slower pace in the third quarter increasing by 1.5% sequentially. This was a smaller gain than the second quarter increase of 4.4%. Compared with a year earlier, shipments are up 2.4%, which was significantly lower than the 6.8% year-over-year growth in the second quarter of this year.
Find loads and trucks on the largest load board network in North America.
Note: All rates exclude fuel unless otherwise noted.
The U.S. Bank Report, which is based on $31.4 billion in freight payments, cited the following impacts for this quarter’s performance:
- An increase in the COVID-19 Delta variant
- General supply chain constraints
- Auto plant slowdowns/shutdowns due to supply chain and microchip shortage
- Seasonal storms
Unlike other freight payment indices, the U.S. Bank Index breaks freight spend and shipments into four regions, which showed mixed results for the third quarter. The West and Midwest regions were particularly notable:
- The West Region reported:
- Robust growth as a result of higher import volumes
- Shipments are up 13.8% quarter-by-quarter and 17.3% year-over year
- The Midwest reported:
- Poorer results due to severe weather, including Hurricane Ida that made landfall in Louisiana
- Shipments volumes were down just under 1% this quarter and are now down 5.2% y/y
Oversea commodities are spending months on boats
As of the start of this week there were a total of 75 container vessels at anchor off the coast of Los Angeles. While 33 are physically anchored and the other 42 “loitering” further offshore, the ports of Long Beach and Los Angeles consider vessels within 40 miles of both ports to be “inport.”
There were a total of 30 container vessels at berth unloading, which is slightly above the long-term average of 28 vessels. The Port of Los Angeles reports that the average wait time at anchor is 13.4 days. When added to the current 4-5 days spent unloading and reloading at berth, this is a considerable amount of time and delay to shippers looking to import goods from overseas.
The container ship A KINKA has been at anchor or loitering the longest since arriving from Yantian China on September 12 — or 50 days ago this week. On top of the 21-day sailing time from Asia, A KINKA has been enroute to a U.S. port for a total of 71 days!
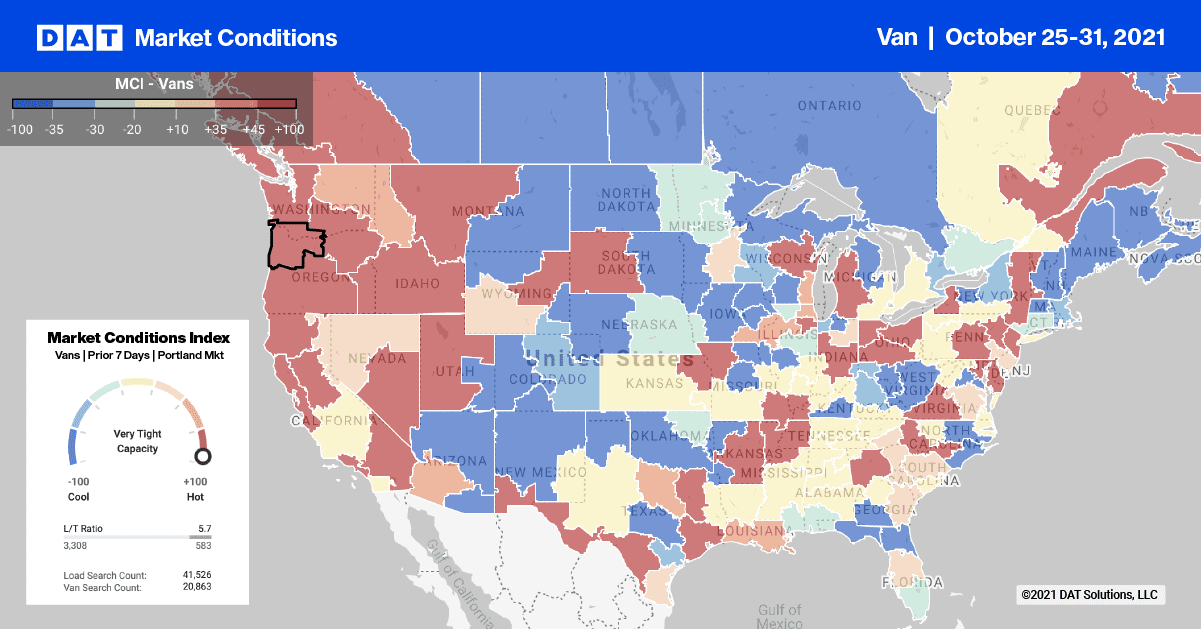
Truckload capacity continues to tighten in and around Los Angeles where spot rates inched $0.01/mile higher last week to an outbound average of $3.37/mile. Load post volumes jumped 14% in the combined Los Angeles and Ontario markets while higher volumes of the Los Angeles to Stockton lane set another record weekly high of $4.30/mile last week.
Spot rates
After declining for the previous two weeks, last week’s national average dry van spot rate remained unchanged, which is quite unusual for end-of-month. It’s another sign that the past 12 months of tight capacity is easing.
Of our Top 100 lanes (for loads moved), spot rates:
- Increased on 21 lanes (compared to 23 the week prior)
- Remained neutral on 28 lanes (compared to 38)
- Decreased on 28 lanes (compared to 39)
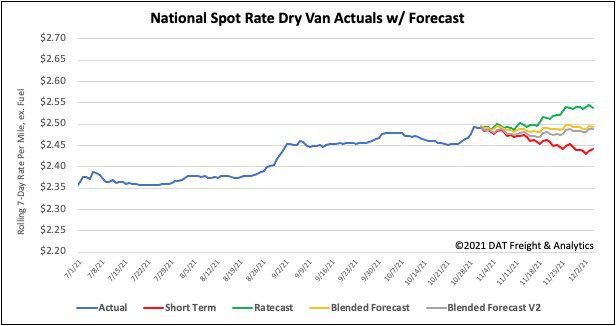
How to interpret the rate forecast:
- Ratecast: DAT’s core forecasting model
- Short Term Scenario: Formerly the pessimistic model that focuses on a more near-term historical dataset
- Blended Scenario: More heavily weighted towards the longer-term models
- Blended Scenario v2: More heavily weighted towards the shorter-term models


