While supply chain disruptions continue to create tight truckload freight markets, there are signs that the markets will soften in the weeks and months ahead, according to the Pulse Signal Report from DAT iQ.
In January, truckload volume rose 3% year over year for members of the Freight Market Intelligence Consortium – a group of leading shippers that use DAT iQ data to inform their transportation procurement and operations. Breaking out freight volumes by equipment and rate type, a more bifurcated market picture emerges.
While dry van total volumes for January 2021 increased 3% y/y, contract volumes decreased by 6% y/y. In contrast, spot volume increased 80% y/y. The temperature-control sector was a similar story: total volume down 6% y/y, with contract decreasing 10% and spot increasing 50% y/y.
After increasing by 15% in the week prior, dry van load posts dropped by the same amount last week in the top 10 markets, which represent 25% of weekly load posts. Despite that, tight capacity pushed up rates by $0.12/mile on average.
Find dry van loads and trucks on the largest load board in North America.
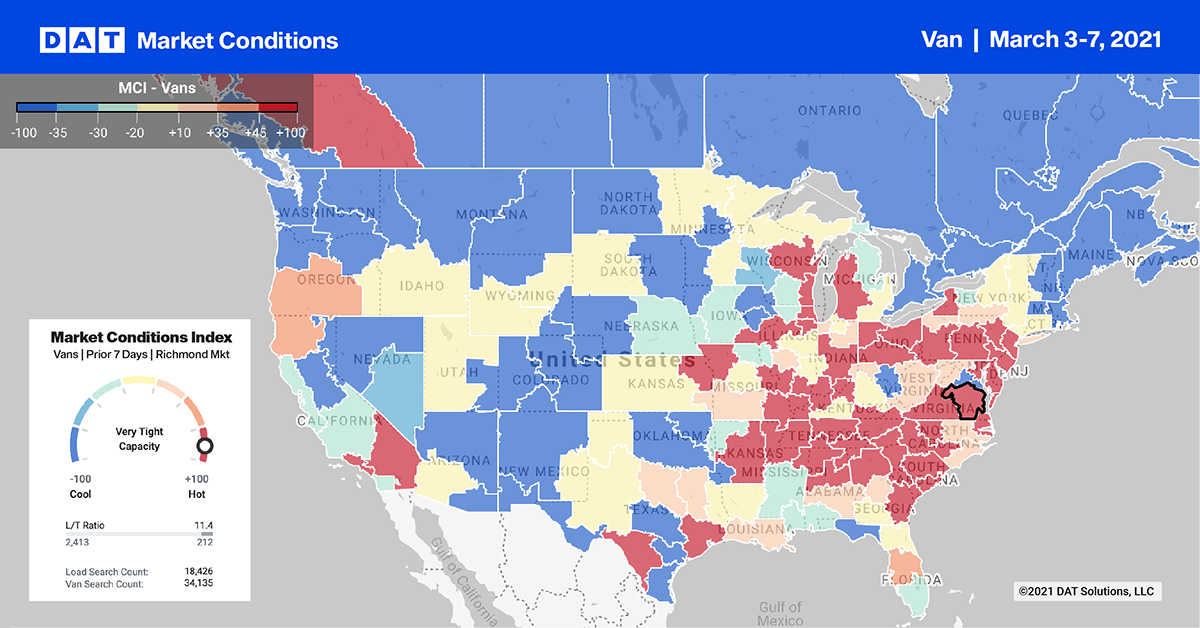
On the West Coast, load volumes declined by 8% w/w in Los Angeles and by 16% in Ontario, CA. Rates were up almost $0.16/mile in both markets.
In the Midwest, Chicago and Joliet, IL, volumes dropped by 23% and 27% respectively, while rates increased to $3.17/mile and $3.20/mile, excluding fuel surcharges.
Outbound rates in Atlanta increased by $0.14/mile even though volumes dropped 15%. Farther west in Memphis, rates increased by the same amount as volumes dropped 7% w/w.
Spot rates forecast
With the majority of roads clear and temperatures rising, carrier networks returned closer to normal. Available capacity remains tight, though, pushing spot rates up again for the third week in a row. Last week the national average van rate jumped by another $0.09/mile to end the week at $2.44/mile, excluding fuel.
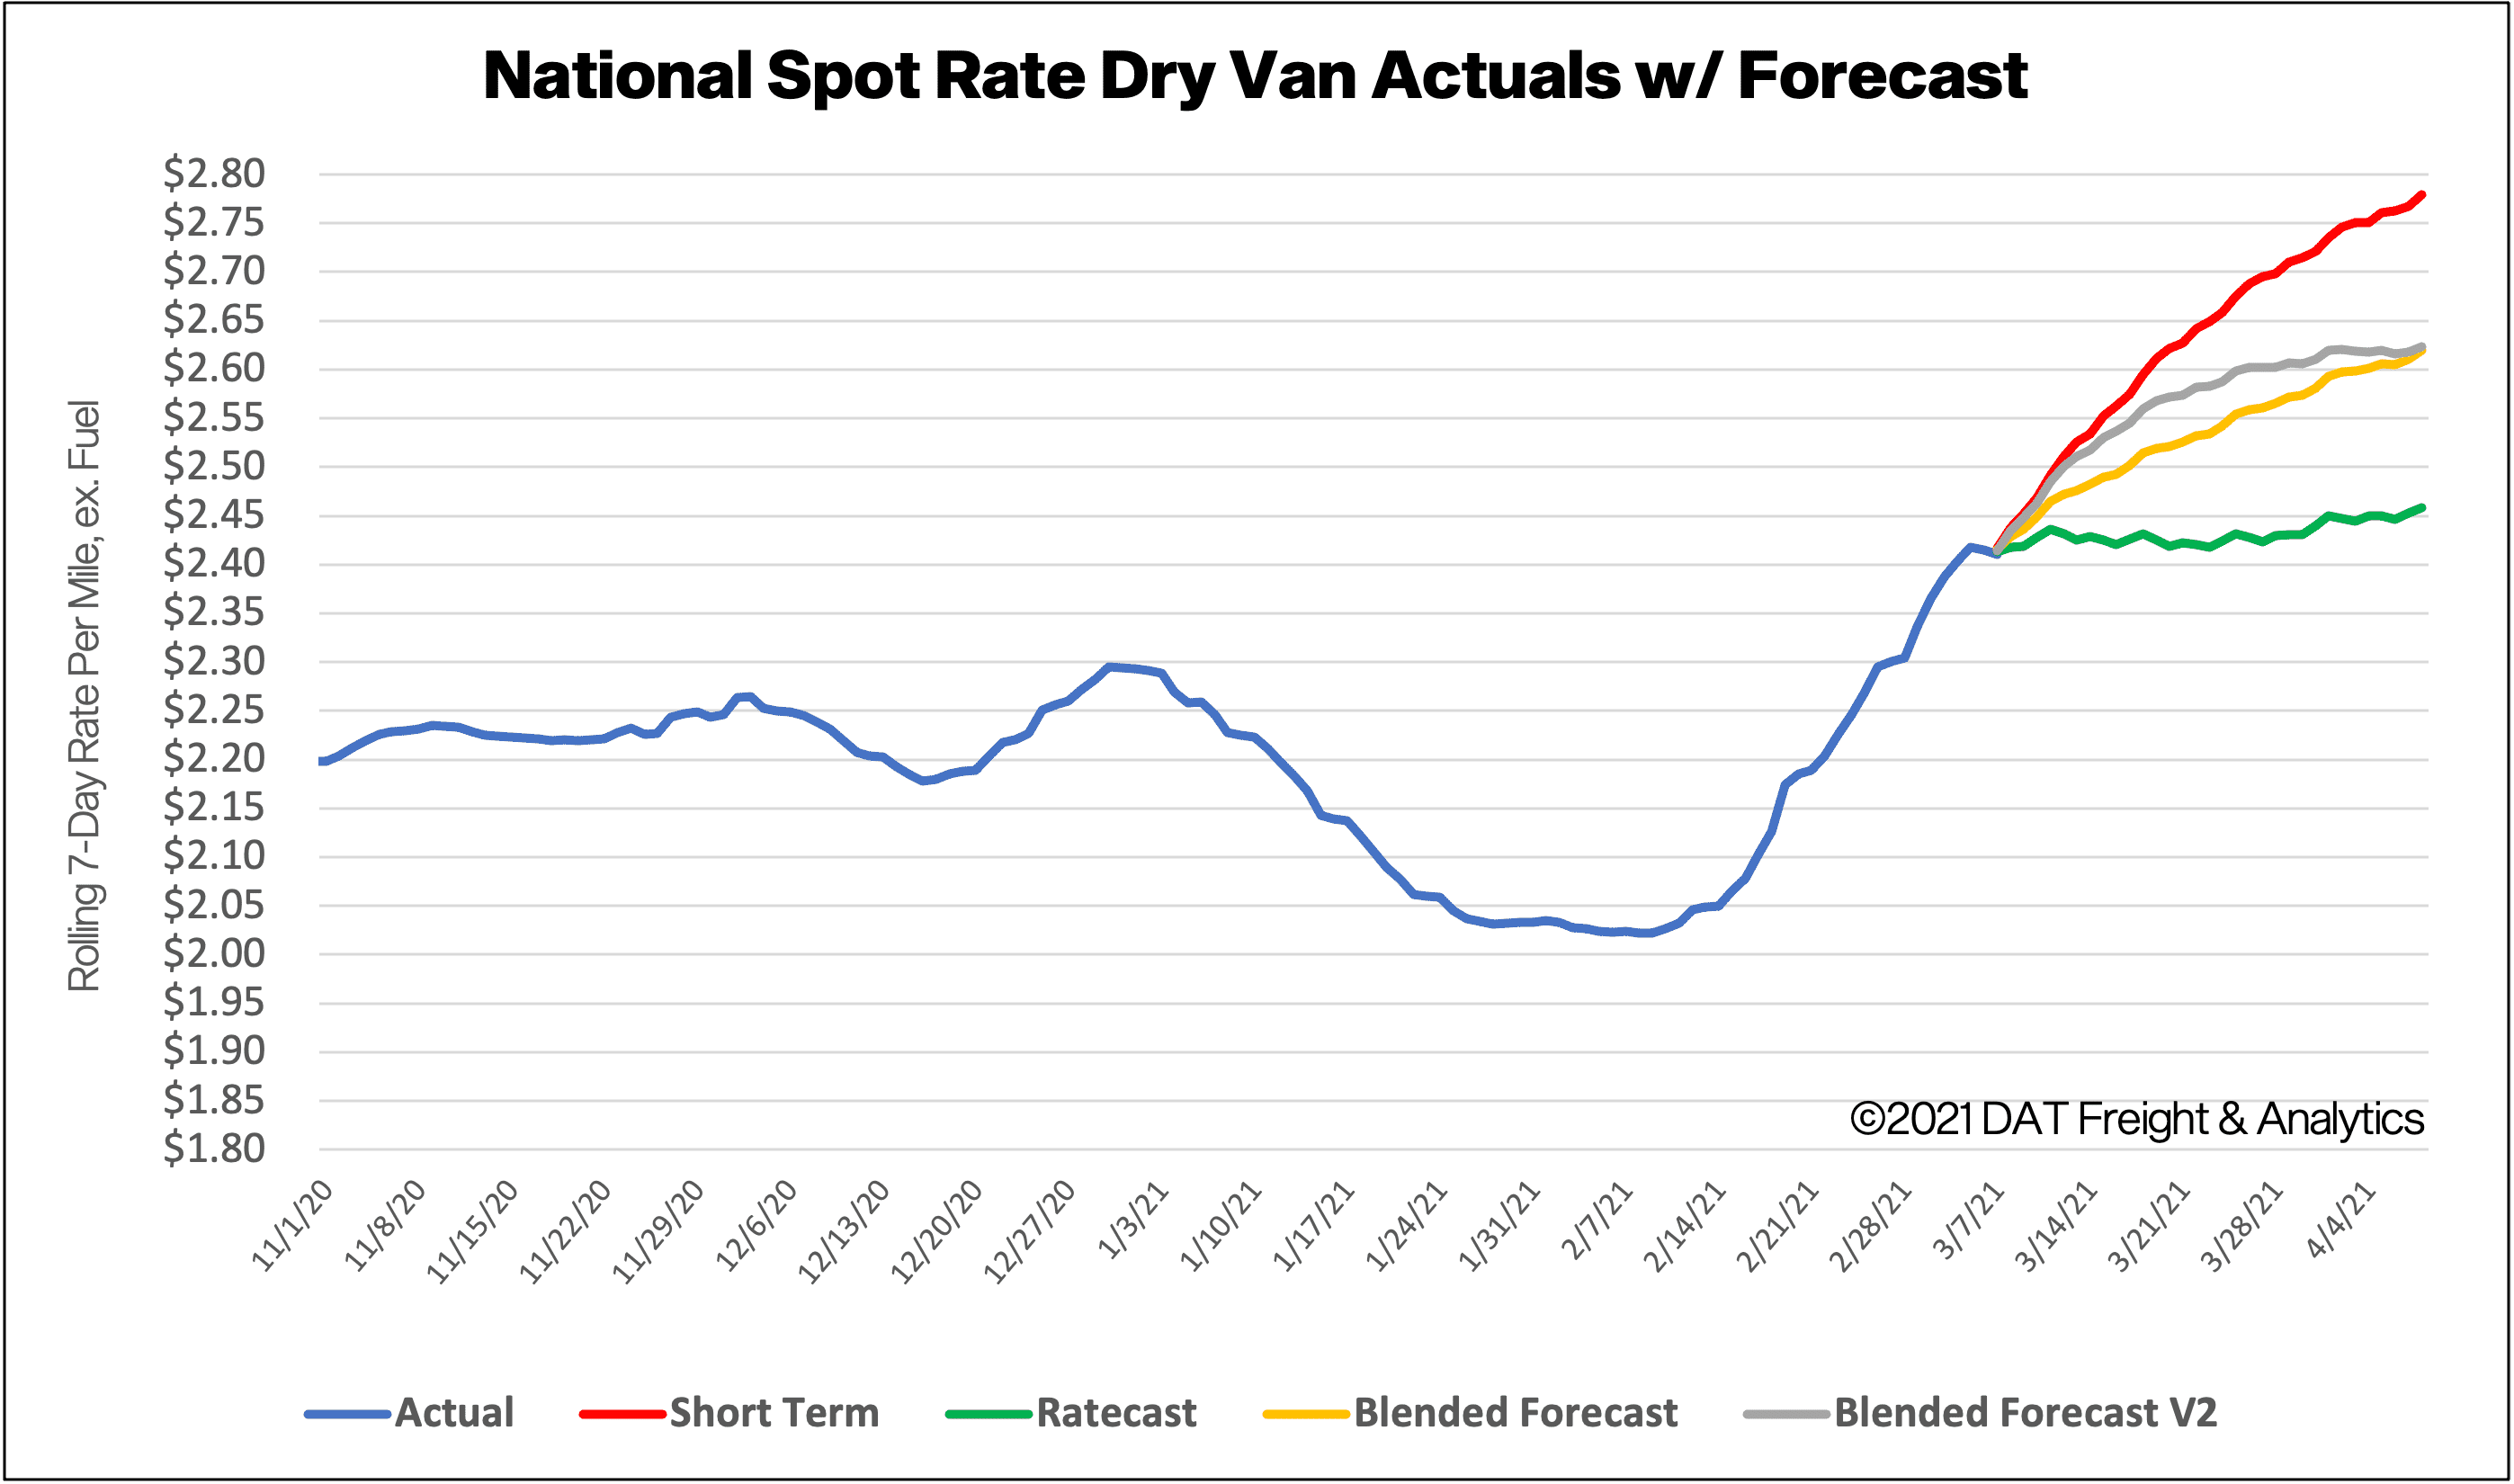
How to interpret the rate forecast:
- Ratecast: DAT’s core forecasting model
- Short Term Scenario: Formerly the pessimistic model that focuses on a more near-term historical dataset.
- Blended Scenario: More heavily weighted towards the longer-term models.
- Blended Scenario v2: More heavily weighted towards the shorter-term models.


