A break in the weather amplified a surge in spot market freight availability during the first full week of the new year. Load posts on the DAT Load Boards jumped an astonishing 74% in the week of January 5 – 11, including an 85% increase in loads designated for vans. Truck posts increased 28%, which is not unusual when a full work week follows one that includes a national holiday such as New Year’s Day.
Rates dropped last week, which would not be surprising after the close of a quarter, but high volume usually increases pressure on rates. The end result was a 1¢ dip in van rates, to a national average of $1.94 per mile, including fuel. This is still a very high rate, only 1¢ below the peak for all of 2013. More surprisingly, van rates hit that peak in the final week of the year, exceeding even June’s average.
National average reefer rates lost 3¢ last week, as freezing temperatures literally nipped Florida crops in the bud and brought grapefruit and vegetable harvests to an abrupt and premature end.
Individual markets exhibited much bigger rate swings for both equipment categories, as you can see in DAT Trendlines.(For detailed rates and capacity trends in thousands of lanes across the U.S., you’ll want to subscribe to DAT RateView.) Flatbed activity is typically subdued in the winter, and the severe weather caused national average rates in that segment to plunge 7¢. I will re-visit that segment next week.
This has been a most unusual season. I keep using that word: “unusual.” I am looking at different analyses and news stories, trying to find explanations for these unique patterns, and I have come to the conclusion that the trucking industry is in the midst of a sort of “perfect storm,” with volume and rates buoyed by three main factors:
1. Extreme Weather. Temperatures were way below freezing — or even below zero Fahrenheit — and freight couldn’t move. It froze in Texas, in Florida. Forget Minnesota. Then there would be a thaw, and shippers were scrambling for trucks. Rates bounced around, with lane rates seesawing up and down by 25¢ or even 35¢ per mile from one week to the next.
2. Economic Growth. Overall, the economy is not exactly recovering. Unemployment is down, but the work force participation rate is low. Even so, some economic indicators are showing signs of life. Durable goods, raw materials, housing starts and some retail categories are improving. Exports are up, and so are imports, including NAFTA goods that move by truck. Those sectors generate freight, and there is more of it.
3. Inventory Management. I have seen conflicting reports about the relative strength of Christmas retail sales, but stores do seem to be re-stocking now. It also seems apparent to me that many companies have become more conservative in their inventory management strategies, and they are keeping inventory lean. That’s great for the balance sheet, but when the weather gets crazy or consumers buy more than the retailers expected, re-stocking can become urgent, and shippers can get a little more flexible about paying for transportation.
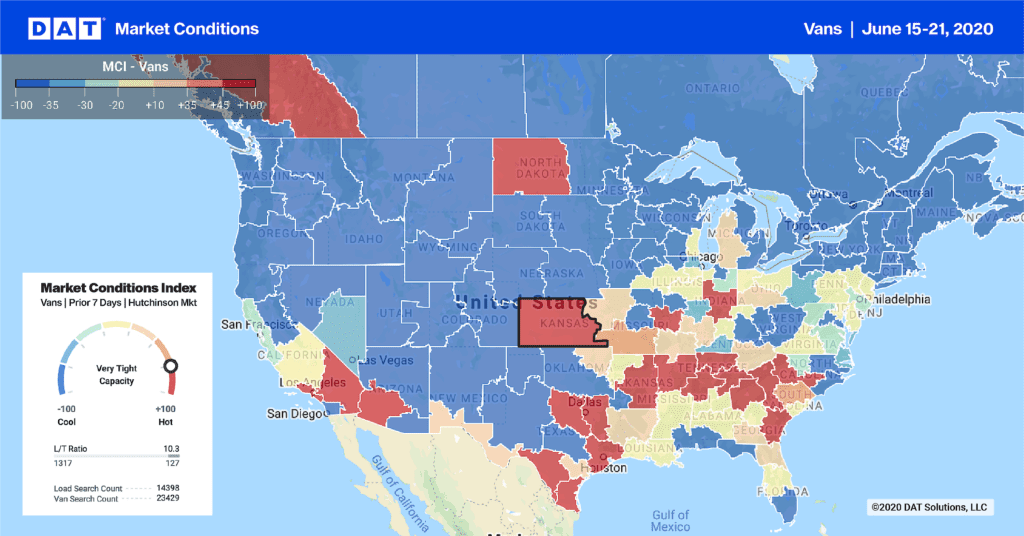
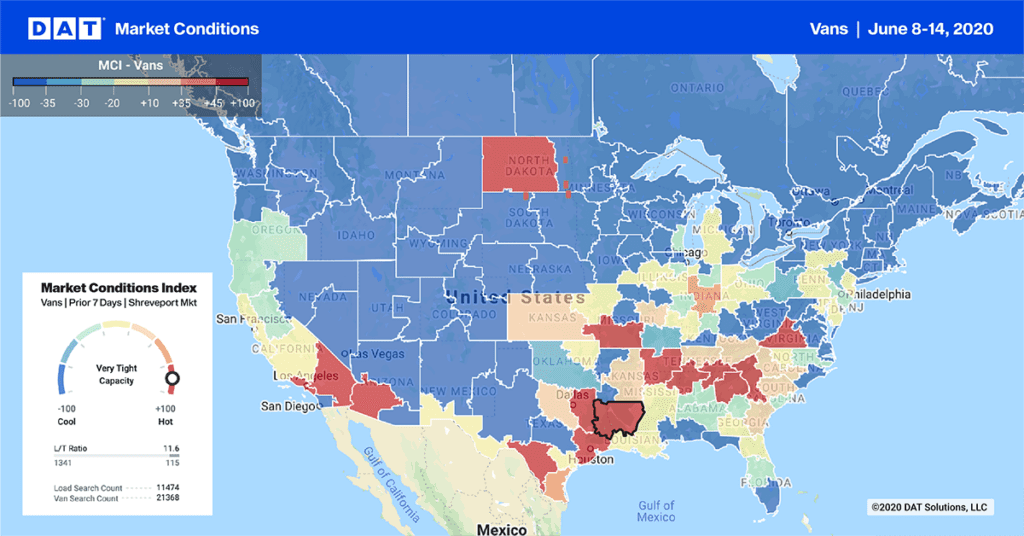
This heightened level of activity is not an isolated phenomenon. With a few exceptions, markets across the entire continent are offering unprecedented volumes of freight for the month of January. The Hot Market Map below depicts a snapshot of load-to-truck ratios for 155 markets in the U.S. and Canada, based on yesterday’s load and truck posts on the DAT Load Boards. It is very unusual (there’s that word again) to see so many markets shaded in that dark brown, indicating load-to-truck ratios above 5.7, at this time of year. The map looks more like July than January.
Meanwhile, I’m still waiting for the usual winter doldrums to set in. This used to be the slow season!
Not this year.
In the Hot Market Map above, freight volume is ebbing seasonally in parts of Washington, California, Nevada, Texas, and Florida. The rest of the country is awash in freight, which is unusual for the month of January. Hot Market Maps are a feature of DAT Power Load Boards and DAT RateView


