February can be a tough month for transportation companies. Rates on many lanes hit their lowest points of the year during this stretch of winter, and prices were definitely trending downward to close January.
The overwhelming majority of the top 100 van lanes on the spot market saw lower rates last week — 81 lanes, to be exact. The numbers were similarly tilted for both reefers.
There were a couple silver linings, though. Volumes have held steady, even though a lack of urgency on the part of shippers has kept rates down. And even though prices are down practically everywhere, most declines were fewer than 10¢ per mile.
DAT load boards are the largest and most trusted digital marketplace for truckload freight.
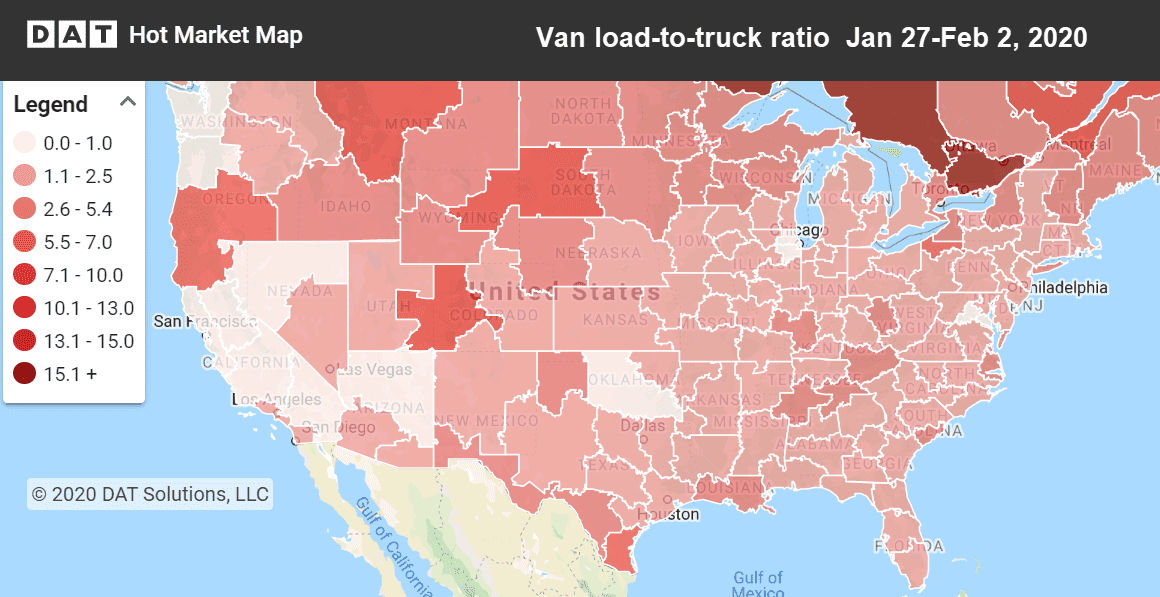
Hot Market Maps show the number of available trucks vs. available loads and are available in the DAT Power load board and DAT RateView.
Dry van trends
Obviously peak retail season is well behind us at this point, but if you needed any further proof, look at the lane from Columbus, OH, to Buffalo, NY. Prices on that lane are often affected by activity in retail warehouses, and the average rate last week was $2.96 per mile. It was $3.38 per mile as recently as Jan. 10.
Allentown, PA, to Boston is another example of that trend. Last week’s average rate was $3.36 per mile. That might sound high, but don’t forget to account for the traffic and tolls on that lane, plus the fact that you’ll have a hard time finding a load out of Boston. It’s down 30¢ from where it was three weeks ago.
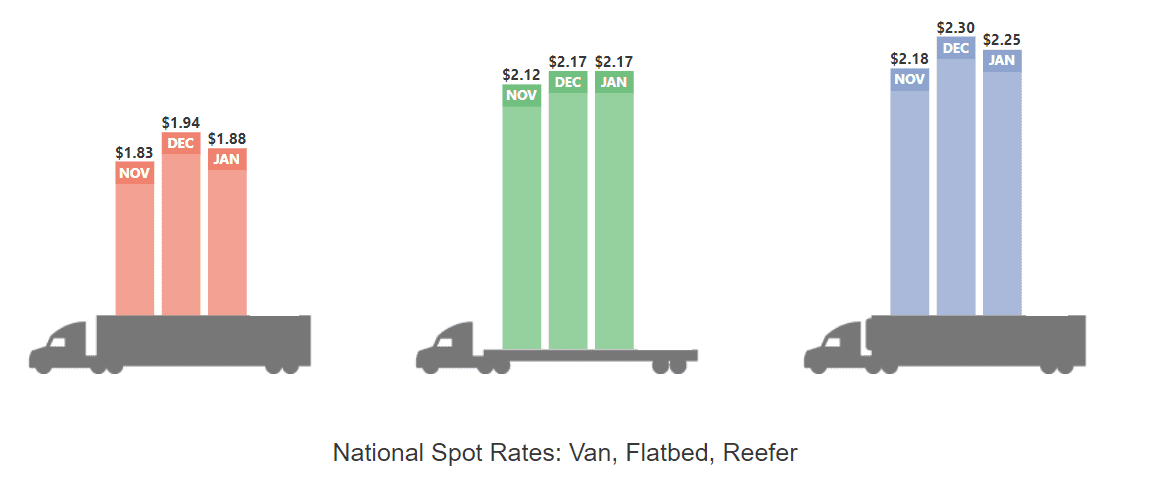
January’s national average rates were down compared to December, but higher than November for all three equipment types.
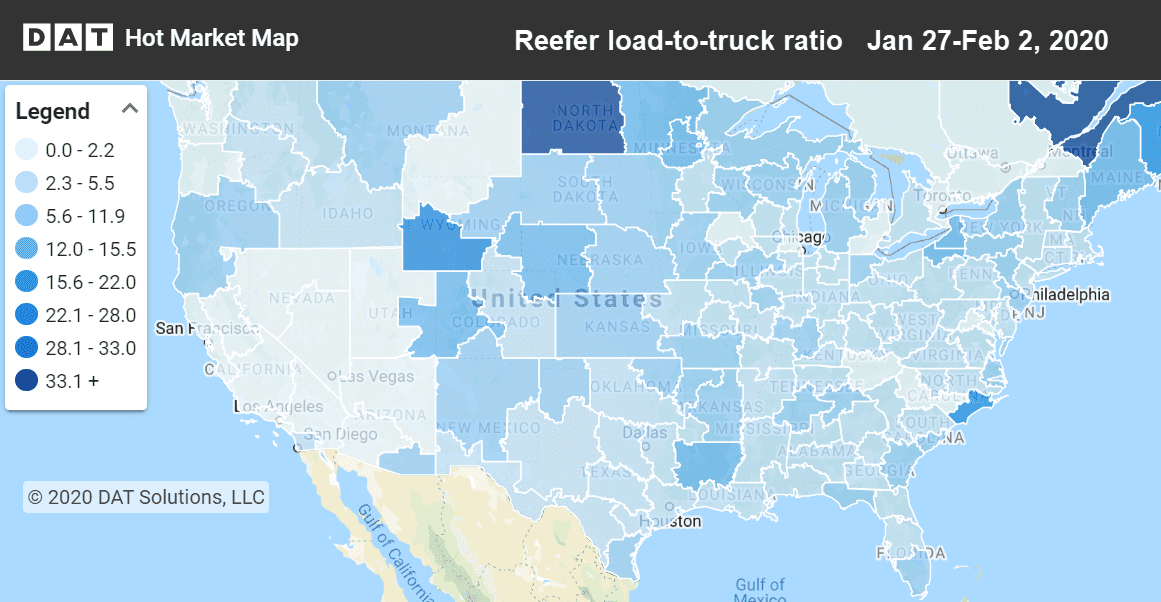
Reefer trends
The declines have been more dramatic for reefer loads. Demand remained high in early January but has fallen off sharply in recent weeks, with the load-to-truck ratio dropping 10% last week. That means brokers and shippers are having a much easier time finding available trucks, and when reefer demand cools, it tends to drag van rates down as well since reefer carriers can look for van loads when reefer freight isn’t available.
The biggest price movements last week were on lanes in and out of Georgia: Atlanta to Philadelphia (down 20¢), and McAllen, TX, to Atlanta (down 15¢).
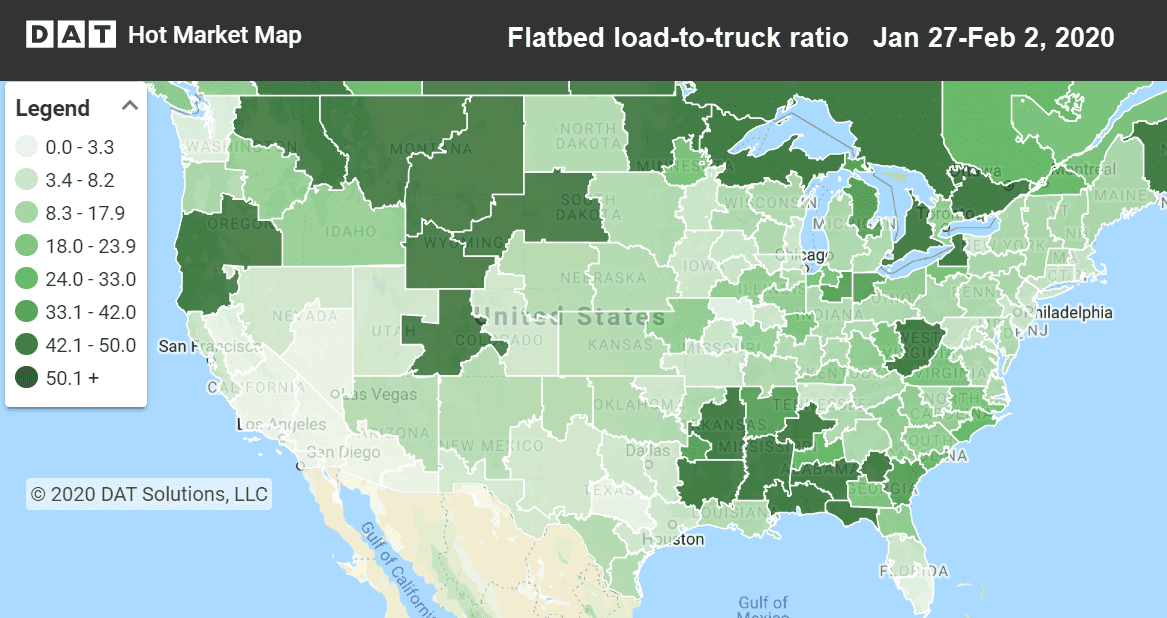
Flatbed trends
Week-over-week and month-over-month comparisons are a bit more favorable for flatbed freight, since that segment didn’t get the same lift in December that vans and reefers did. While load-to-truck ratios for van and reefers fell sharply in January compared to December, the flatbed ratio rose 28 percent.
There was a strong uptick in volume to close the month as well, and the pricing picture is a lot more mixed than compared to other segments. Prices on key lanes out of Memphis and Atlanta largely held, with the lane from Atlanta to Houston seeing a big increase in demand to close the month.


