The mid-year peak in produce shipments has come and gone for another year. And even though demand is improving, weekly volumes are still down 6% this year for domestic produce shipments but up 24% for imported truckloads. The combined result (domestic and imported shipments) for the week ending July 3 is a positive one. Volumes are up 3%, or the equivalent of 1,712 additional truckloads, compared to the same week last year.
Peak volumes typically occur 10-14 days before Independence Day and then begin to taper off until Thanksgiving. This explains the 16% decrease in truckload volumes last week following the prior week’s peak. Between July 4 and Thanksgiving, weekly truckload volumes of produce decrease on average of 21%. This translates to carriers hauling 7,300 fewer truckloads per week by the time Thanksgiving rolls around.
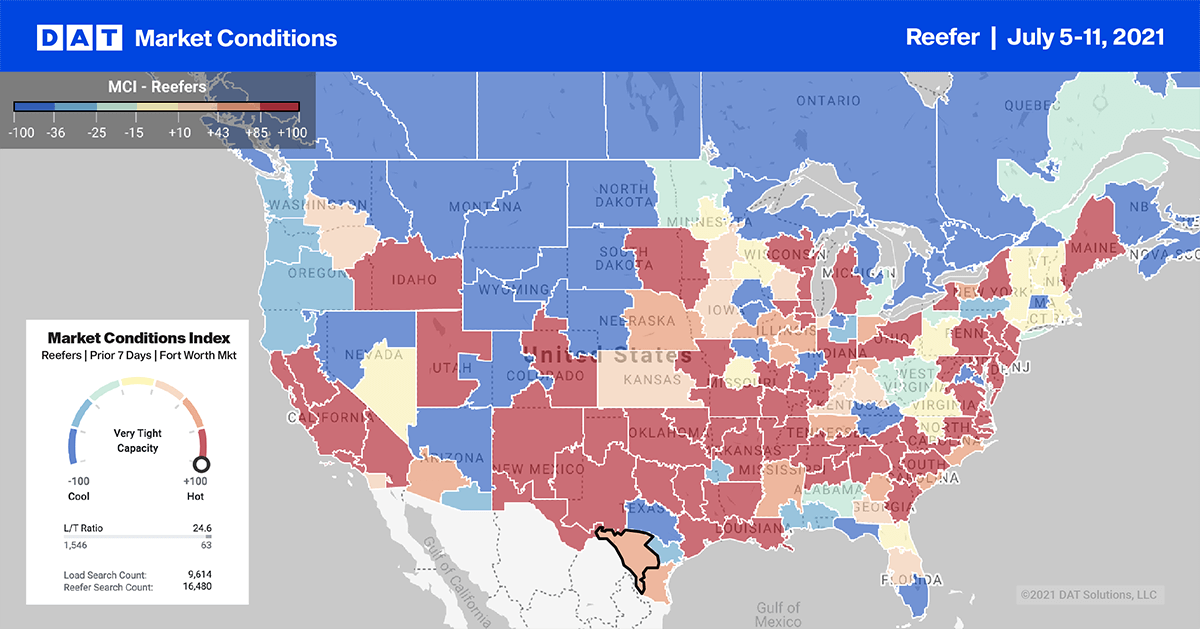
Reefer capacity is still very tight with the USDA reporting a shortage of trucks in six of 23 produce regions last week. There’s also a slight shortage in 15 of 23 markets — only two produce regions (Louisiana and Mississippi) reported an adequate supply of trucks.
Trucks were in highest demand for:
- Citrus in the South District in California
- Tomatoes in North and West Florida
- Potatoes in San Luis Valley in Colorado
- Onions in South Georgia
- Sweet potatoes in Eastern North Carolina
- Tomatoes, cantaloupes and watermelons in South Carolina
Find loads and trucks on the largest load board network in North America.
Note: All rates exclude fuel unless otherwise noted.
On the 784-mile run from Dallas to Atlanta, reefer spot rates were up $0.23/mile last week to $3.29/mile after decreasing for the prior two months. Spot rates took off on the Atlanta-Chicago 716-mile run last week, increasing by around $0.50/mile to an average of $3.61/mile. Reefer rates on this lane have increased by $1.80/mile since this time last year and are now more than double compared to this time last year.
Spot rates are also $1.70/mile higher than contract rates, which is highly unusual and partly reflective of declining rates in the opposite direction. Further west, reefer rates on the 270-mile run from Los Angeles to Las Vegas held steady at $6.12/mile last week but jumped $0.25/mile to $5.23/mile in the opposite direction. For carriers loading both ways and completing a roundtrip each day, that’s an average of $5.40/mile.
Spot rates
After the reefer sector recorded the biggest gain in the week prior to July 4, they also recorded the largest decrease last week dropping by $0.05/mile to $2.78/mile. Reefer rates are still $0.73/mile higher than this time last year and $0.48/mile higher than this time in 2018.
For context, that makes last week’s spot rates around 41% higher than the same period over the last five years.
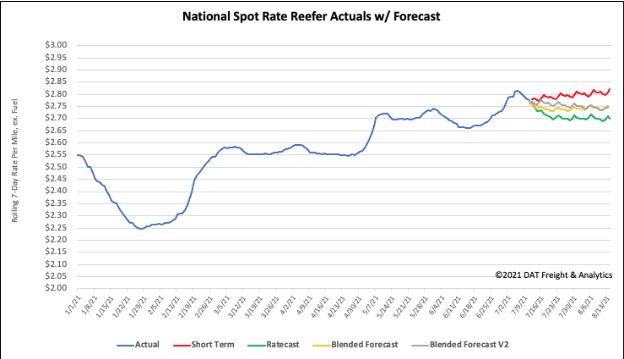
How to interpret the rate forecast:
- Ratecast: DAT’s core forecasting model
- Short Term Scenario: Formerly the pessimistic model that focuses on a more near-term historical dataset
- Blended Scenario: More heavily weighted towards the longer-term models
- Blended Scenario v2: More heavily weighted towards the shorter-term models