Most potatoes in the United States are now sold in processed forms such as frozen, chipped, dehydrated, or canned. With the introduction of french fries as a critical side dish in quick-service restaurants, the share of potatoes that go into frozen products has risen in each decade since 1979 (from 33% to 45% in 2021). As a result, almost half of all potatoes going into food in the United States are now used to create frozen products—most of which are french fries.
Get the clearest, most accurate view of the truckload marketplace with data from DAT iQ.
Tune into DAT iQ Live, live on YouTube or LinkedIn, 10am ET every Tuesday.
Driven by the rise in demand for ready-to-eat (RTE) food, North America was the largest region in the global French fries market, estimated at almost $15 billion in 2023. The rise in demand for RTE food, which is pre-cleaned, pre-cooked, wrapped, and ready to consume without any prior preparation or cooking, is expected to propel the growth of the French fries market going forward. According to industry data and the USDA Economic Research Service (ERS), about 90% of frozen french fries move through various food service venues. Quick-service restaurants alone account for about two-thirds of french fry usage.
For truckload carriers, Idaho remains the largest producer of fresh potatoes (25%), followed by Colorado and Wisconsin, each at 10% of annual volume. Canada and Michigan round out the Top 5 with 8% and 7%, respectively. The production of French fries is quite different, though. Located in the Pendleton freight market, Othello, Washington, is regarded as the French fry capital of the world. Every year, the three potato processing plants in town run by J.R. Simplot Co and McCain’s produce 1.5 billion pounds of frozen french fries, tater tots, and hashbrowns — the equivalent of almost 35,000 refrigerated truckloads annually.
Market watch
All rates cited below exclude fuel surcharges unless otherwise noted.
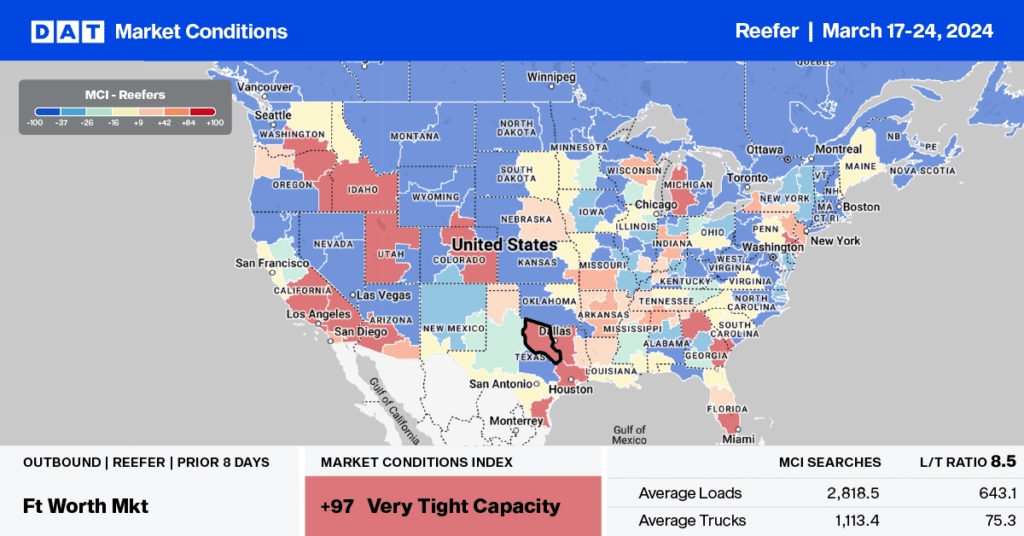
Available reefer capacity was tighter last week in Los Angeles following last week’s $0.03/mile increase to $1.95/mile for outbound loads. The volume of outbound loads moving was down 6% w/w but remains up 5% month-over-month (m/m) and 17% y/y. On the high-volume lane north to Stockton, rates surged, increasing by $0.08/mile last week to $2.62/mile, while in Fresno, carriers were paid an average of $1.94/mile, up $0.01/mile w/w on a 6% lower volume of loads moved.
In Florida, where outbound produce volumes are on par with last year, available capacity tightened in Miami, where linehaul rates increased by $0.03/mile to $1.36/mile on a 6% higher volume. In nearby Lakeland, linehaul rates increased by $0.03/mile to $1.42/mile on an 11% lower volume of loads.
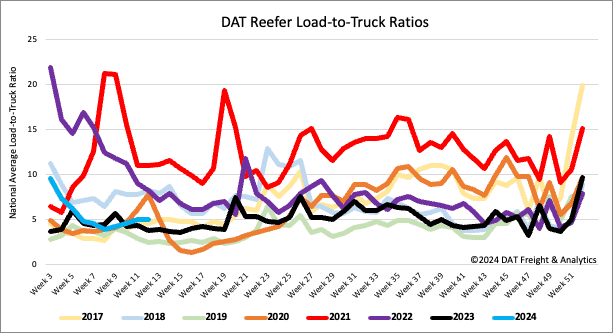
Load-to-Truck Ratio
After increasing for four successive weeks, reefer load post volume decreased following last week’s 3% drop, trailing last year by 4%. Available capacity decreased following last week’s 3% slide in equipment posts, increasing the load-to-truck ratio unchanged at 5.22.
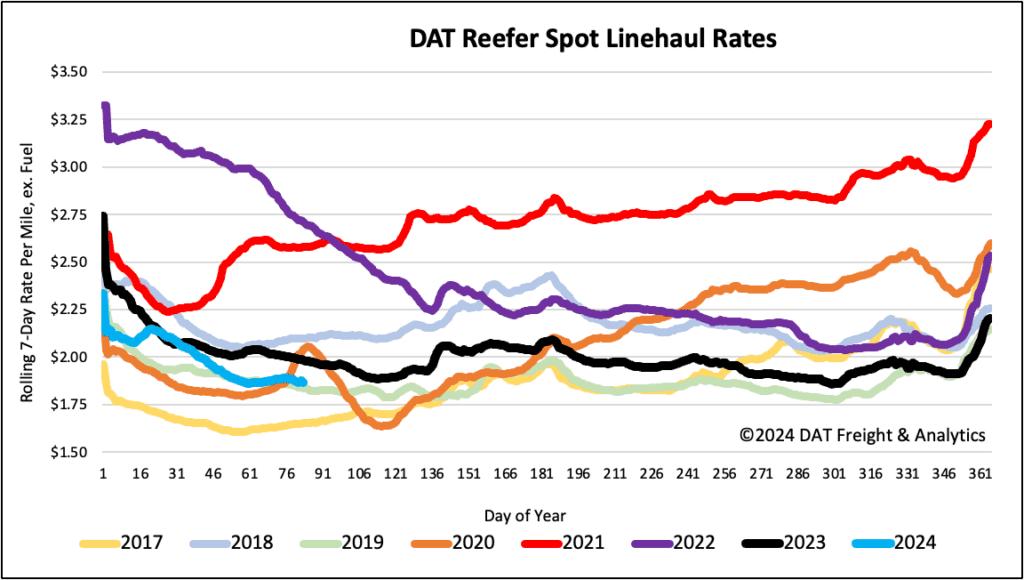
Spot rates
After being mostly flat for a month, reefer spot rates increased by almost $0.01/mile last week even though the national volume of loads moved was down by just over 10%. At $1.90/mile, reefer linehaul rates are $0.11/mile lower and $0.03/mile higher than in 2019.