The May 2022 TIndex was materially unchanged compared to April, recording a 102.8 value. However, when analyzing against May 2021, the industry has grown by 9%. Each index number corresponding to the same month in 2019. Therefore, the May 2021 index of 102.8 suggests that the sector is 2.8% larger than it was in May 2019. The TIndex is based on several datasets available to Technomic, including operator transactions, consumer visit tracking, and distributor sales information on the U.S. foodservice industry.
According to Joe Pawlak, managing principal at Technomic, “We’re seeing the impact of inflation across industries, and food service is no exception. The industry shows signs of year-over-year growth, but when factoring in inflation rates of 7.4%, the industry is only growing 1.5% on a real basis. We can expect softening traffic in restaurants as consumers continue to tighten up discretionary spending”.
Foot traffic trends from Placer.ai show that the grocery and superstore segments maintained their growth compared to 2019, though the traffic increases were more limited than earlier. Full-service restaurants took an expected step back as visits to this sector were uniquely impacted by the current inflationary challenges. At the same time, Quick Serve Restaurants and coffee-oriented chains saw much more minimal declines. When comparing y/y trends, they caution against using 20-21 due to the irregularities of the foot traffic due to lockdowns. Placer.ai tracks the foot traffic of numerous industries through anonymous location data from tens of millions of mobile devices.
All rates cited below exclude fuel surcharges unless otherwise noted.
Outbound linehaul rates in Fresno, CA, the largest produce market in the state, dropped for the third week following last week’s $0.03/mile decrease to $2.37/mile. Load post volumes also fell by 33% w/w. In Toledo, OH, capacity has been tightening for the last three weeks following last week’s $0.07/mile increase to an average of $2.25/mile. At $822/load, loads 250 miles west to Chicago are around $140/load lower y/y, while long haul loads south to Raleigh, NC, are up $0.20/mile in the last three weeks to an average of $2.71/mile or $0.74/mile lower than the previous year.
Reefer capacity in Boston has been loosening for the past three weeks – outbound linehaul rates are down $0.22/mile over that timeframe to an average of $1.57/mile. In Harrisburg, PA, spot rates jumped by $0.23/mile to $2.68/mile, and on the 720-mile haul south to Atlanta, spot rates are up $0.14/mile in the last three weeks to an average of $1.83/mile. Capacity was flat for loads to Boston at $4.07/mile last week, while loads to Bristol, NH, surged by $0.65/mile above the June average to $4.24/mile last week.
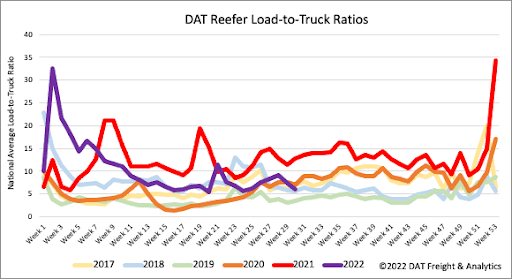
Like dry van, reefer carrier equipment posts are at record-high levels for this time of the year and around 2% higher than the over-supplied 2019 reefer market. Load post volumes cooled last week, dropping 17% w/w and 7% below 2020 levels. As a result, the reefer load-to-truck (LTR) ratio declined for the third week in a row to 5.99 and was almost identical to this time in 2020.
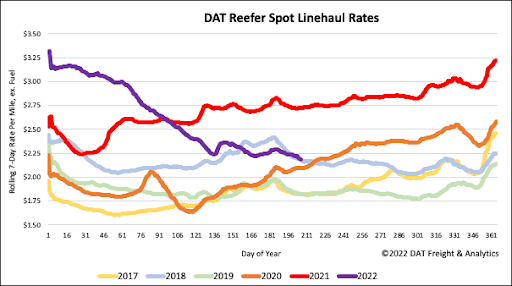
Reefer linehaul spot rates are identical to this time in 2018, following last week’s $0.01/mile decrease to a national average of $2.24/mile. Compared to the previous year, reefer spot rates are $0.54/mile lower but still $0.30/mile higher than the pre-pandemic average for this time of the year.