According to the National Retail Federation (NRF) annual consumer survey, spending on Mother’s Day is expected to be the second highest in the survey’s history, following last year’s record $35.7 billion. At an expected $33.5 billion, spending could be around 6% lower than last year, with 84% of U.S. adults expected to celebrate the holiday. On average, those celebrating plan to spend $254.04 on Mother’s Day gifts and celebrations, the second-highest per-person figure, following last year’s record $274.02 per person.
Get the clearest, most accurate view of the truckload marketplace with data from DAT iQ.
Tune into DAT iQ Live, live on YouTube or LinkedIn, 10am ET every Tuesday.
As with previous years, the most popular gifts to give are flowers (74%), greeting cards (74%), and special outings such as dinner or brunch (59%). Consumers will spend $7 billion on jewelry, $5.9 billion on special outings, and $3.5 billion on electronics. Additionally, total spending on flowers is estimated to reach $3.2 billion, while total spending on greeting cards is expected to reach $1.1 billion this year.
“While consumers continue to appreciate classic Mother’s Day gifts like flowers and greeting cards, a significant one-third of them are planning to gift unique experiences this year,” shared Prosper Executive Vice President of Strategy Phil Rist. “This shift in consumer preferences presents a unique opportunity for retailers to offer innovative products or services. Consumers also intend to spend more on special outings than they have in the past.” This year, online (35%) remains the most popular shopping destination, followed by department stores (32%), specialty stores (29%) and local or small businesses (25%).
As the leading authority and voice for the retail industry, the NRF provides invaluable insights into consumer behavior and spending for critical periods such as holidays throughout the year. The survey of 8,213 U.S. adult consumers, conducted from April 1-8, carries a margin of error of plus or minus 1.1 percentage points, ensuring the accuracy and reliability of the data.
Market watch
All rates cited below exclude fuel surcharges unless otherwise noted.
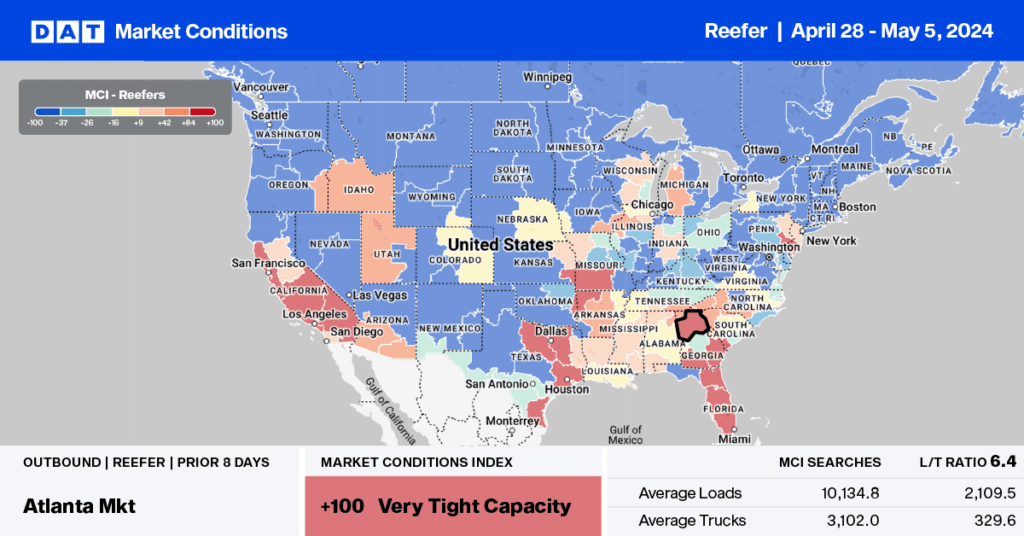
According to the USDA, there was a shortage of trucks in Florida last week, primarily for spring vegetable loads to Baltimore, Boston, Philadelphia, and New York. Northbound reefer capacity typically tightens in the lead-up to Mother’s Day on May 12th, especially for loads out of Miami, where most rose and carnation imports are processed. Loads moved were up 16% last week, creating a short-term capacity crunch and pushing up outbound reefer linehaul rates by 25% to $2.18/mile. On the top lane to Atlanta, carriers were paid an average of $2.21/mile last week. That’s almost identical to the May average last year.
Produce loads from Central Florida around Lakeland to New York paid carriers $2.83/mile last week, up $0.47/mile week-over-week (w/w) on a 23% higher volume of loads moved. Capacity was very tight on the Lakeland to Baltimore lane, where linehaul rates averaged $2.69/mile, almost $1.00/mile higher than last month’s average and $0.08/mile higher than last year’s May average linehaul rate.
Load-to-Truck Ratio
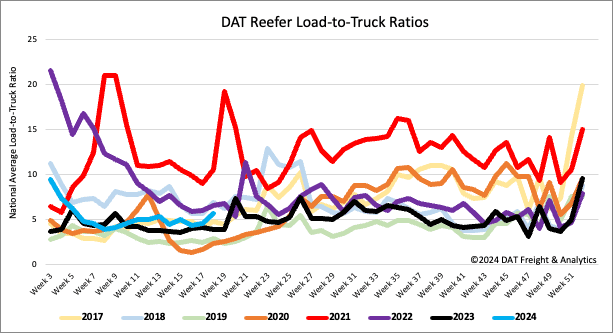
Early season strength in the produce market, led by California, where volumes are 18% higher year over year, boosted the truckload spot market following last week’s 12% increase in load post volume. Available capacity decreased as equipment posts dropped by 8% w/w, increasing the reefer load-to-truck ratio by 22% w/w to 5.62.
Spot rates
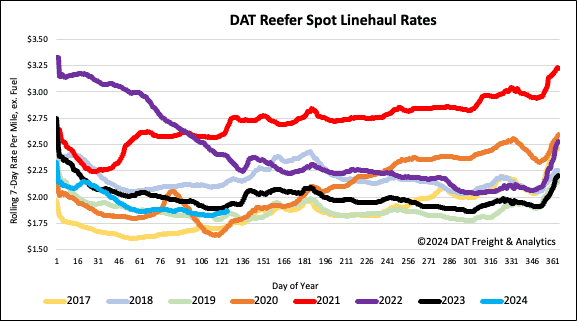
As produce season and Mother’s Day floral shipments push meaningful volumes into the truckload spot market, reefer linehaul rates are on the rise following last week’s $0.04/mile gain. At $1.89/mile, reefer linehaul rates are $0.06/mile lower on a 10% higher volume of loads moved than last year.
