Peak-shipping season has been creating havoc across supply chains this year. This can be seen by the number of container ships waiting to unload at major ports and adjacent warehouses overflowing with inventory.
Ports like Seattle in the Pacific Northwest (PNW) saw a constant wave of loaded import containers being discharged from vessels sitting on the docks with nowhere to go. As a result, dwell times are climbing.
Find loads and trucks on the largest load board network in North America.

Note: All rates exclude fuel unless otherwise noted.
“The import dwell time is three times what it was,” says Ed DeNike, president of the largest terminal in Seattle, SSA Containers. “Imports are not being picked up at the terminals because the warehouses are full.”
When this happens, everything slows down, including fewer ship-to-shore per vessel operating. This cascades into more vessels bunching up at anchor.
Delays don’t stop there. Further along the supply chain, chassis trailers are sitting longer at shipper warehouses waiting to unload. And even when they’re empty, there isn’t sufficient space back at the overcrowded port to receive the empty containers.
Chassis street dwell time, a measure of how long chassis are stuck at warehouses and rail ramps, now exceeds nine days in Seattle. This has added to the current shortage of 53’ intermodal containers in the PNW.
According to the Journal of Commerce, this is happening because railroad infrastructure design never considered what would happen when containers turn slowly due to shippers not unloading intermodal boxes enough.
This has led to higher demand for truckload capacity to pick up the shortfall resulting from the intermodal container shortage on lanes from Seattle to Chicago and Los Angeles. Loads moved in the last four weeks have increased by 16% (SEA to CHI) and 2% (SEA to LAX) respectively. Spot rates were also up 11% and 6% month-over-month respectively.
Port congestion continues
Freight congestion in the Southern Californian ports of Long Beach and Los Angeles continues to worsen and dominate the news despite best efforts to increase productivity.
Truckload volumes on highly competitive intermodal lanes including Los Angeles to Chicago continue to climb. This follows the tenth consecutive week of intermodal losses (down 7.8% year-over-year) and inland intermodal congestion.
Loads moved within the DAT freight network on the Los Angeles to Chicago lane were up 5% last week and are now up 118% compared to the same week last year. Spot rates for dry van loads are up 16% to an average of $2.90/mile, or $0.33/mile higher, than the same time last year. It was this time last year when the first big wave of container imports hit the West Coast.
In the country’s number two port in Elizabeth, NJ, truckload volumes (loads moved) west to Chicago were up 14% last week (up 72% since last month). Spot rates continue to set new records at an average of $2.19/mile last week. Capacity in the Elizabeth market did appear to loosen last week following a $0.06/mile decrease to an average outbound spot rate of $2.36/mile.
Spot rates
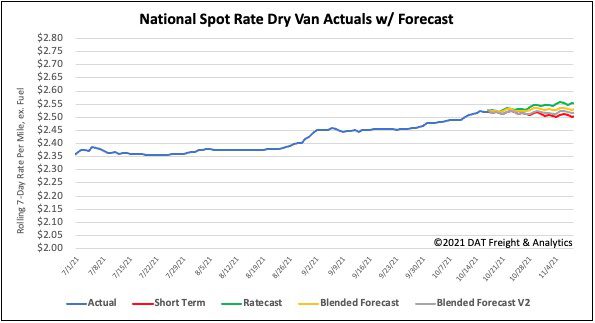
After increasing by $0.12/mile over an 11-week period, last week’s national dry van spot rate reversed course. The national dry van spot rate dropped by just over $0.01/mile to an average of $2.52/mile. Dry van rates are still 12% or $0.30/mile higher than this time last year.
Of our Top 100 lanes (for loads moved), spot rates:
- Increased on 25 lanes (compared to 38 the week prior)
- Remained neutral on 43 lanes (compared to 34)
- Decreased on 32 lanes (compared to 28)

How to interpret the rate forecast:
- Ratecast: DAT’s core forecasting model
- Short Term Scenario: Formerly the pessimistic model that focuses on a more near-term historical dataset
- Blended Scenario: More heavily weighted towards the longer-term models
- Blended Scenario v2: More heavily weighted towards the shorter-term models


