Van freight didn’t see a big boost in the last full week of October, and rates on the 100 highest-traffic lanes were mostly neutral. Not much happened until the end of the week, when volumes started to climb in Southern California. That could lead to stronger trends this week, and it looks like load posts rose quite a bit on Halloween, for an end-of-month treat.
But even if the end of October was relatively quiet, the month as a whole was strong compared to last year.

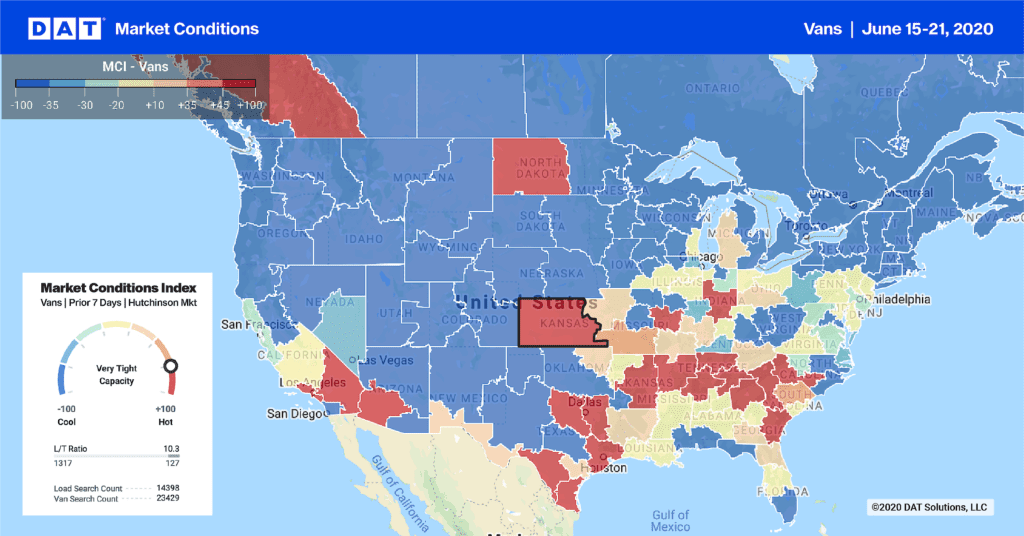
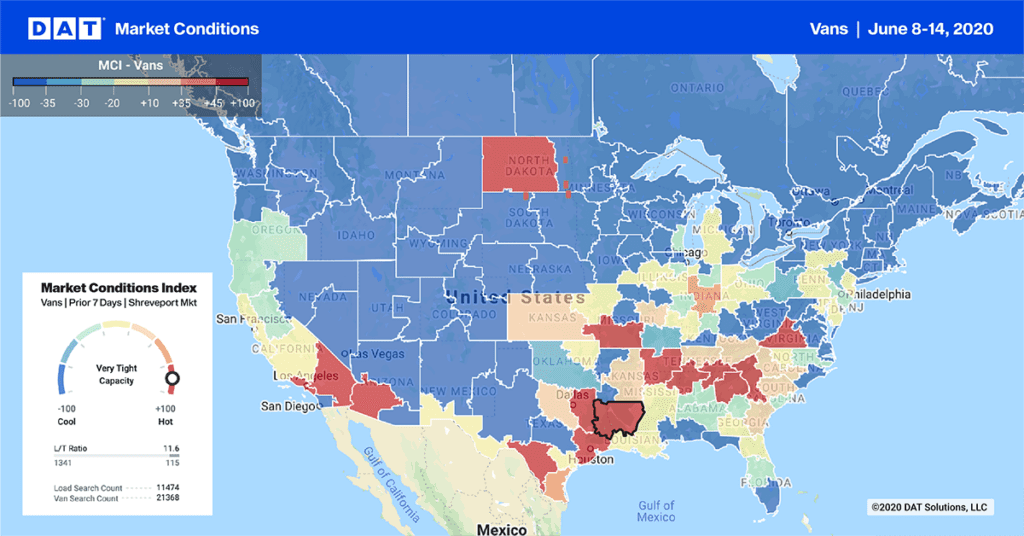
Darker-colored areas have higher load-to-truck ratios, meaning that there’s less competition for van loads in those markets.
In the Hot Market Maps above, you can see that demand for trucks was a lot stronger last month than it was in October of 2015. In fact, the map looks pretty similar to 2014, when a slew of issues (HOS rules, port labor issues, weather, etc.) led to tight capacity and high rates.
Three major van markets had outbound rates rise least 2% for the month of October: Los Angeles, Dallas, and Denver. Volumes also rose significantly in L.A., Atlanta, and Chicago. Van rates barely moved on a majority of the 100 highest-volume lanes last week, but pricing stabilized in Charlotte after some up-and-down weeks following Hurricane Matthew.
Lane-by-lane rate information and Hot Market Maps are available in the DAT Power load board. Rates are based on DAT RateView, with $28 billion in lane rates, updated daily, for 65,000 point-to-point lanes across North America.


