The 2022 Bridge Report prepared by The American Road & Transportation Builders Association (ARTBA) says that 78,000 bridges – or 36% of nearly 224,000 total spans – need repair work or replacement based on a study of the Department of Transport 2021 national bridge inventory. If placed end-to-end, these bridges would stretch over 6,100 miles or about the distance from Los Angeles to Portland, ME, and back again.
The more severe issue for truckers is the bridges rated “structurally deficient” in need of constant maintenance. The latest report puts this number for 2021 at 43,758, and even though that’s 1,445 fewer than 2020, it would take nearly 30 years to repair them all at the current pace. A bridge classification of “structurally deficient “ does not mean the bridge poses a safety risk or is likely to collapse but does have cracks, damage, wear, or other problems that if not monitored or fixed, could become worse and lead to failure in the future.
Get the clearest, most accurate view of the truckload marketplace with data from DAT iQ.
Tune into DAT iQ Live, live on YouTube or LinkedIn, 10am ET every Tuesday.
But won’t the infrastructure bill fix this problem?
Even though the new Federal Infrastructure Investment and Jobs Act (IIJA) provides states with resources to make overdue improvements to roads and bridges, the $40 billion allocated to states for bridge repairs falls a long way short of the estimated $260 billion to repair all bridges, including the 43,578 structurally deficient, according to the ARTBA. The estimated cost to replace just the structurally deficient bridges based on average price data from the U.S. DOT is over $58 billion. The IIJA represents significant progress in rebuilding our nation’s bridges after years of neglect, and even though the number of bridges in poor condition declines slowly, the average age of U.S. bridges is steadily increasing and now at 44 years, just six years short of the designed lifespan of 50 years for the country’s bridges.
The American Society of Civil Engineers (ASCE) reports 42% of all bridges are at least 50 years old and even higher for structurally deficient bridges, which average 69 years.
Which states should truckers be on the lookout for?
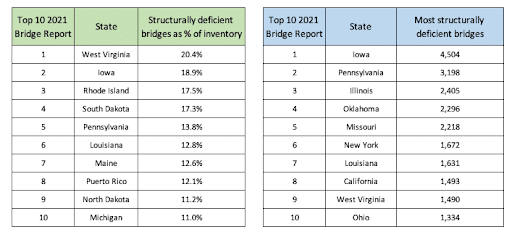
Even though Texas has the most bridges by a factor of two compared to the next nearest state of Ohio, the state with the most structurally deficient bridges as a percentage of their total bridge inventory is West Virginia for the second year in a row according to the ARTBA. Of all bridges in that state, 20.4% (n=1,490) are in poor condition and require monitoring with the 57-year old bridge on I-64 West in Charleston, WV, where it crosses over the Kanawha Turnpike, the most frequently used structurally deficient West Virginia bridge with just under 69,000 daily crossings. Iowa is another state to keep an eye on as it ranks number two with 18.9% of inventory structurally deficient but number one as the state with the most bridges in poor condition (n=4,504).
The ARTBA Top 10 states for structurally deficient bridges are: