Over the last 18-months, one of the most common questions we get each week on our live Weekly Market Update show is about demand. More specifically, why demand on some lanes and freight types are red hot while others are stone cold.
Jason Miller — Associate Professor of Supply Chain Management at Michigan State University — is shares his thoughts to help us answer this question.
Get the clearest, most accurate view of the truckload marketplace with data from DAT iQ.
Tune into DAT iQ Live, live on YouTube or LinkedIn, 10am ET every Tuesday.
Guest writer: Jason Miller
Why has capacity in the for-hire truckload and less-than-truckload markets been so tight in 2021?
This question is something we’ve heard throughout the year from shippers as they hope for relief from record spot and contract rates. I will offer two demand-driven explanations for this question while recognizing that the slow recovery of trucking employment is certainly another factor.
Demand for trucking is not at record levels
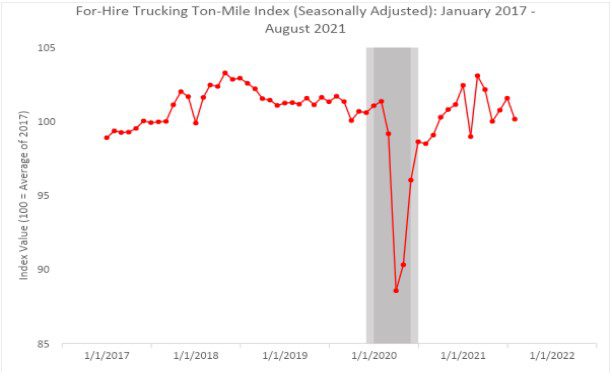
To begin, I want to point out an important fact about demand for truck transportation. The preponderance of evidence points to total demand for truck transportation being below peak levels witnessed in the second quarter (Q2) of 2018.
My colleague Yem Bolumole and I produced the for-hire trucking ton-mile (FHTTM) index. It calculates implied not-miles based on physical output from 41 freight-generating sectors that is then weighted based on the Commodity Flow Survey. The FHTTM index indicates that seasonally adjusted activity for Q2 2021 was 1.8% below Q2 2018 levels.
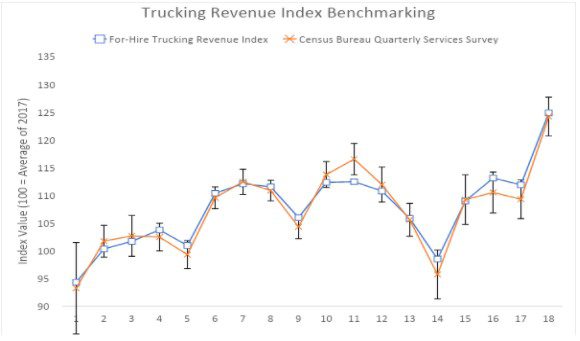
Readers may be unfamiliar with this index since it was just created. To provide evidence of validity, Yem and I convert ton-miles to revenue by multiplying the monthly values with the corresponding producer price index for truck transportation from the Bureau of Labor Statistics. We then benchmark the resulting for-hire trucking revenue (FHTR) index with the Census Bureau’s measure of truck transportation revenue from the Quarterly Services Survey.
As can be seen in the second plot, the correspondence is striking, which suggests our ton-mile index is indeed capturing physical output.
But the mix of freight is very different
While overall ton-miles may not have recovered to their early 2018 peak levels, there has been a dramatic shift in demand at a more granular level. I expect this is an important reason freight markets have been so disrupted since June 2020.
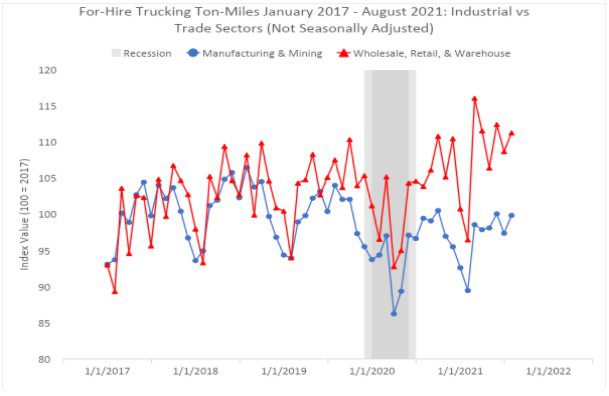
To illustrate, the next plot decomposes ton-miles into shipments made by the manufacturing or mining sectors (industrial) and those made by the wholesale, electronic shopping & mail order houses, and warehousing (trade).
As can be seen, following the start of the COVID-19 pandemic, the two series diverged sharply, whereas they had increased at roughly the same pace in 2017 and 2018. The divergence has been especially pronounced since March 2021, corresponding to the last round of large-scale government stimulus that has driven unprecedented demand in the retail sector. For the six-month inclusive period of March 2021 through August 2021, trade ton-miles were 5.4% above March 2018 through August 2018 levels.
In contrast, for the six-month inclusive period of March 2021 through August 2021, industrial trade ton-miles were 4.9% below March 2018 through August 2018 levels. This 10.3 percentage point divergence in ton-mileage growth over this three-year interval poses problems for carriers because their cost structures are predicated on assembling freight networks with balanced lanes, which is made more difficult when freight is growing at dramatically different rates.
The February 2021 polar vortex disrupted more than roads
In addition to the change in freight mix, the other demand-related event in 2021 that cannot be understated is the February polar vortex. It brought economic activity to a near standstill in states such as Texas and Oklahoma.
The size of this disruption can be clearly observed in another index Yem and I produce that combines our FHTTM index with an index of all rail carload and intermodal loadings. This index, which we term the surface transportation index (STI), is shown below.
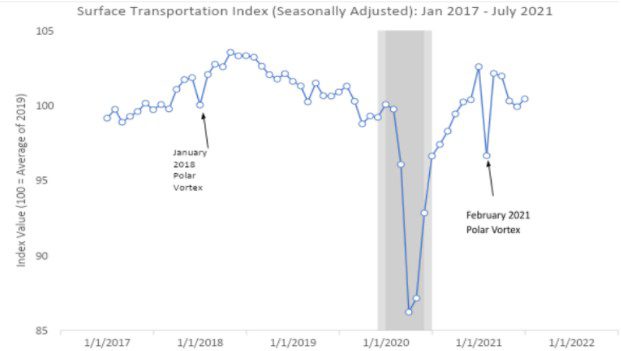
On a seasonally adjusted basis, February 2021 shows a 6% month-over-month decline. This is substantially larger than the 3.8% month-over-month decline witnessed in March 2020 from February 2020 (corresponding to a state of national emergency being declared). It’s also almost as large as the subsequent 10.8% decline in April 2020 from March 2020 (when a major share of manufacturing activity was suspended).
Disruptions on the rail side, in turn, shifted more volume to the trucking spot market. This can be seen in a seasonally adjusted version of DAT’s dry van truckload spot pricing data that shows a surge in March 2021.
Final thoughts
While the slow rebound of trucking employment has certainly been one cause of tight capacity, the imbalance of freight since the onset of the COVID-19 pandemic (especially in 2021 following the last round of government stimulus), coupled with the severe disruption caused by the February 2021 polar vortex have further contributed to capacity woes.
For shippers, one encouraging sign is that consumer spending is likely to abate following this holiday season, which should help bring more semblance of normalcy to carriers’ freight networks.


