After a strong first quarter, flatbed freight has slowed in April. It’s been a wet month throughout the country, and there’s been a slowdown in oil production in the Permian Basin in West Texas.
There are, however, a number of reasons to be optimistic about the flatbed market, and as you can see in the Hot Market Map, some markets are already recovering.
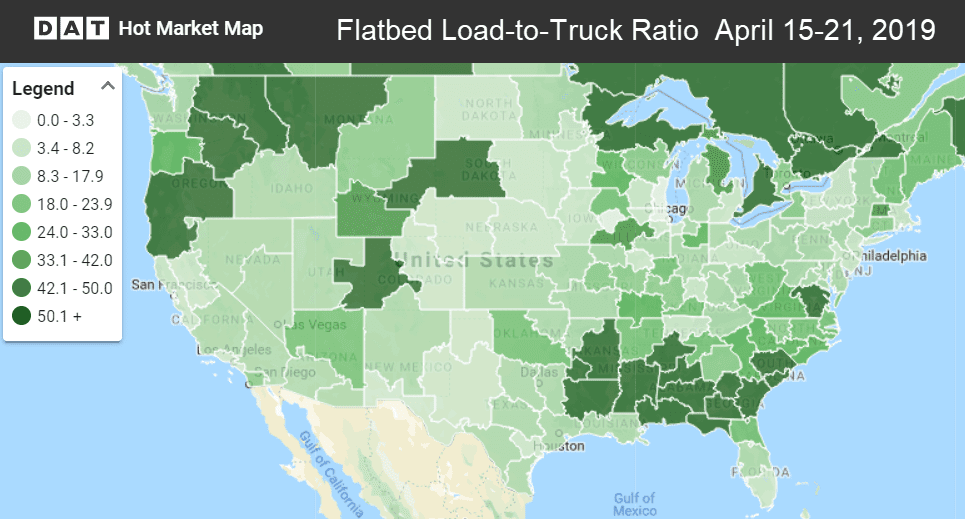
The flatbed load-to-truck ratio was 18.3 last week. Just as we saw with vans and reefers, the flatbed load-to-truck ratio peaked on Tuesday and then stepped down as Good Friday and Easter weekend approached. See how you can view similar maps using DAT’s Hot Market Maps.
Signs of flatbed recovery
1. Better weather – The weather is rapidly improving, which could lead to higher demand in the areas hit by flooding in March.
2. Produce season – Produce season is underway and some crops can be moved short and intermediate distances in open-air containers on flatbeds, including onions, potatoes, and melons.
3. Increased LNG exports – Two major liquid natural gas export terminals on the Gulf Coast have received federal approval, including the $28 billion Driftwood terminal in Louisiana. That should bring increased demand for flatbeds when construction begins.
4. Rates have held steady – Even though freight volumes have fallen in April, the national average rate remains at $2.34/mi., the same as March’s average. And last week more lanes saw rising rates than falling rates. On the top 78 lanes last week, 44 lanes moved up, while 33 were down and 1 was neutral.
Rising rates
A few flatbed markets saw some decent rate increases last week, including Houston, Los Angeles and Las Vegas.
- Houston to Los Angeles surged 46¢ to $2.24/mi. (It’s rare for a longer length of haul to have an increase of this size, which is volume driven. Best of all, it means the LA market is picking up)
- Las Vegas to Phoenix gained 42¢ to $2.97/mi. (Usually it’s L.A. that drives up rates in Las Vegas, so this is another unusual occurrence)
Falling rates
Southeast and Northeast markets faded last week. We saw falling rates in Atlanta, Cleveland and Harrisburg, PA.
- Harrisburg to Springfield, MA plunged 46¢ to $3.60/mi. (Still a good rate for this lane)
- Phoenix to Dallas dropped 36¢ to $1.51/mi. (Not a good rate. It may be that Phoenix doesn’t have supplies to ship to Dallas, as they are bringing in construction materials from Las Vegas and other places)
VAN TRENDS: Easter week started strong before demand dipped
Find loads, trucks and lane-by-lane rate information in DAT load boards, including rates from DAT RateView