U.S. manufacturing new order backlogs have dramatically normalized over the past two years, moving from historic highs to a slow pace. This shift signals a significant change in industrial activity. Given that domestic manufacturing largely drives freight demand, these backlog trends act as an indicator of current demand strength. The Institute for Supply Management’s (ISM) Backlog of Orders Index has hovered below the 50-point threshold for most of 2024, indicating that manufacturers are now burning through existing work faster than new orders are coming in.
Get the clearest, most accurate view of the truckload marketplace with data from DAT iQ.
Tune into DAT iQ Live, live on YouTube or LinkedIn, 10am ET every Tuesday.
The shift in the industrial economy has led to less consistent freight volume for truckload carriers. Professor Jason Miller observed that manufacturers’ order backlogs have historically been a strong indicator of dry van truckload linehaul spot prices, preceding market peaks in 2014, 2017-2018, and late 2020 through early 2022 (Figure 1). Miller’s analysis, using an aggregated measure of order backlogs from five Federal Reserve Board manufacturing surveys (Dallas, Kansas City, Richmond, New York, and Philadelphia), demonstrated a consistent correlation: increased backlogs corresponded with higher dry van spot rates in all three instances.
As of early 2025, backlogs were on an upward trend, coinciding with an initial resurgence in spot rates. However, since March, backlogs have consistently declined. Professor Miller attributes this decline solely to President Trump’s unpredictable tariff policies.


National flatbed spot rates
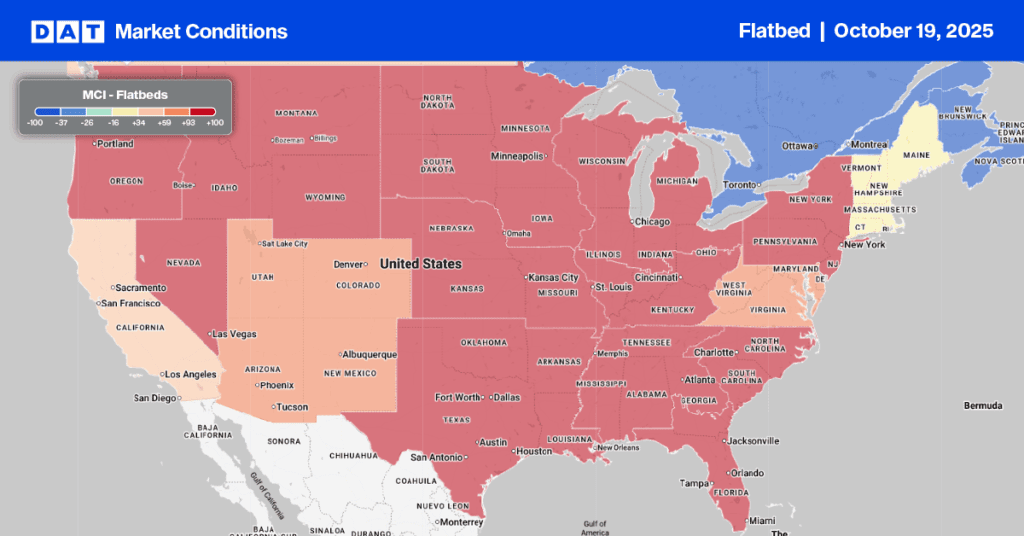
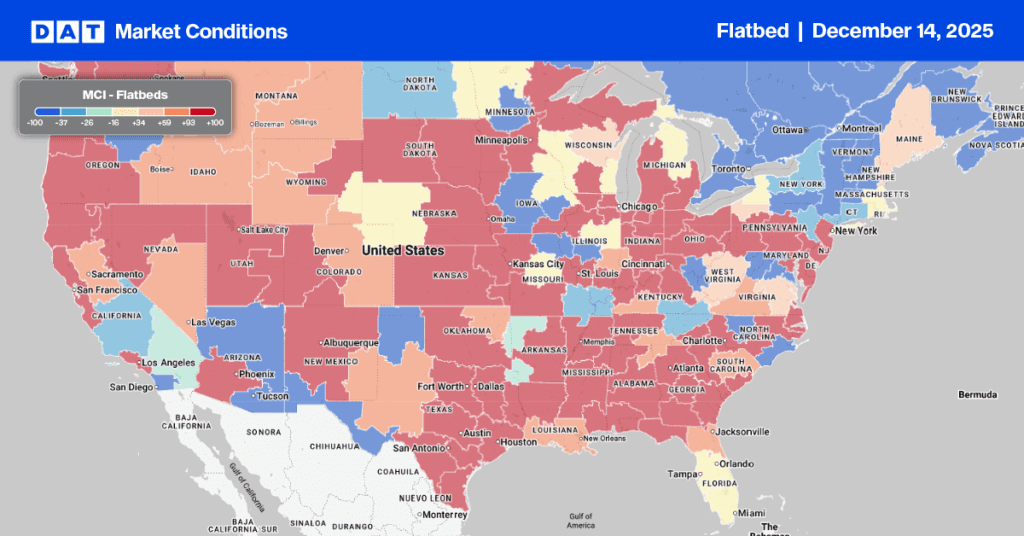
Flatbed rates were flat last week, remaining at $2.07 per mile, $0.10 higher or 5% higher than last year and $0.19 higher than in 2023. Last week, the spot rate surpassed the 2017 rate by $0.02/mile, after closely mirroring it throughout the year.
Flatbed Market Watch

Last week, the flatbed load-to-truck ratio dropped to 25.31. This was a result of an 8% decrease in flatbed load posts and a 4% decrease in equipment posts.
Brokers reported significant capacity constraints in the Pacific Northwest, where load post volume in Portland, the region’s largest flatbed market, increased by 20% and 9% respectively. Spot rates for outbound Portland loads rose by $0.29 per mile (11%), averaging $2.84 per mile for carriers. Capacity was particularly tight on the top volume lane south to Stockton, CA, with spot rates increasing by $0.22 per mile to $2.41 per mile, which is almost 5% higher than the same period last year.


