The U.S. Bank National Shipments Index saw a modest 1.5% increase in the fourth quarter, following a 2.9% contraction in the third quarter. Despite this sequential improvement, overall freight volumes remained low, with shipment numbers declining by 4.9% compared to the prior year. This highlights persistent challenges for both motor carriers and shippers in the freight market.
Get the clearest, most accurate view of the truckload marketplace with data from DAT iQ.
Tune into DAT iQ Live, live on YouTube or LinkedIn, 10am ET every Tuesday.
The index for 2025 indicated a 9.9% drop compared to the 2024 average, when adjusted for the year. Although this represents one of the largest annual decreases ever recorded, it is less than half the 20.4% decline observed in 2024. Freight volumes appeared to bottom out last year, and while 2025 showed limited recovery, the index fluctuated narrowly between 75.0 and 77.2 throughout the year. The fourth quarter did, however, signal a gradual move toward a moderately tighter market.
Analysis of regional data points to a shift in trucking capacity, resulting in mixed freight shipment results but a uniform increase in spending across all areas compared to the third quarter.
Freight Shipments (Q3 to Q4 2025):
- Increases: The Southwest, Midwest, and Northeast all achieved notable quarterly gains, ranging from 3.5% to 5.4%.
- Decreases: Shipments declined in the West and Southeast by 1.3% and 2.4%, respectively.
Year-over-Year Shipment Demand (Q4 2024 vs. Q4 2025):
- Increases: The West and Northeast saw gains, with the Northeast recording a robust 12.1% jump.
- Decreases: The Midwest, Southeast, and Southwest experienced lower freight levels, with the Southwest suffering a steep 25.4% drop.
Despite these uneven shipment volumes, fourth-quarter spending rose almost universally, driven primarily by higher freight rates. This rate increase was evident even in regions with declining freight, where shippers still paid more to transport less. Regions with rising freight volumes experienced even greater spending hikes. The rise in total costs was not due to fuel surcharges, as diesel prices held steady or decreased from the third quarter. Consequently, shrinking capacity appears to be the explanation for the price increases. When compared to the same period in the previous year, only the Southeast region showed a reduction in spending.
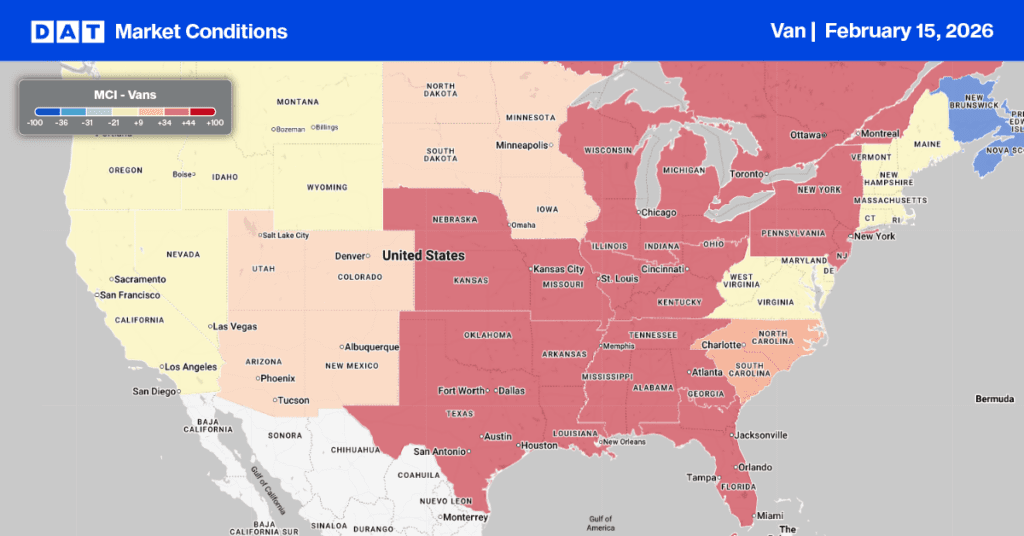
Dry Van Market Conditions Index
Despite a 13% decrease in dry van load post volumes last week, volumes remain robust—70% higher than last year and 125% above the 10-year average (excluding pandemic-impacted years 2021 and 2022). This decrease, combined with a 9% drop in equipment posts, allowed dry van capacity to loosen, settling the national load-to-truck ratio at 9.82.
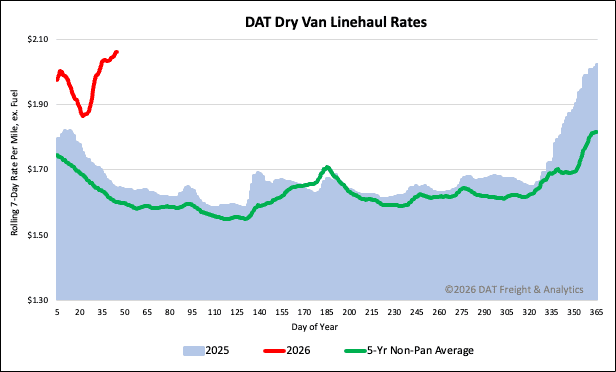
National dry van linehaul spot rates
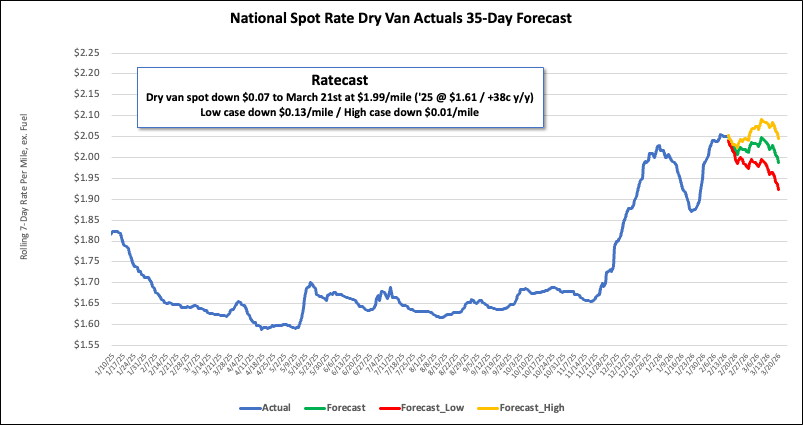
Following the passing of Winter Storms Fern and Gianna, the East Coast freight network experienced improved conditions last week. This allowed for an increase in capacity and a decrease in rates. Nationally, the 7-day average dry van linehaul spot rate dropped $0.02 per mile last week, settling at $2.06 per mile.
The current rate is notably higher than previous years, $0.42 (26%) higher year-over-year. Excluding the pandemic years, it also exceeds the 5-year average by $0.46 (22%).
The average rate for DAT’s top 50 lanes by load volume also decreased by $0.02 per mile last week, averaging $2.30 per mile and $0.24 higher than the national 7-day rolling average spot rate.
In the 13 key Midwest states, which represent around 47% of national load volume and often indicate future national trends, spot rates decreased by $0.02 per mile to $2.56 per mile, which was $0.50 above the national 7-day rolling average.