From a truckload carrier’s seat, January’s ISM Manufacturing PMI of 52.6% reads less like an abstract economic survey and more like a leading indicator of whether the phones start ringing. The report showing manufacturing stabilizing and nudging into expansion territory signals that the long inventory drawdown cycle may be easing. New orders improve matters more to carriers than the headline number itself, because orders are the spark that turns into inbound raw materials, outbound finished goods, and repeat freight cycles through plants and distribution centers. After a year where manufacturing quietly worked against truckload demand, even modest momentum changed expectations around lane density, tender volumes, and how aggressively shippers shop the spot market.
Get the clearest, most accurate view of the truckload marketplace with data from DAT iQ.
Tune into DAT iQ Live, live on YouTube or LinkedIn, 10am ET every Tuesday.
That said, this is not a “flip the switch” moment for carriers. Employment inside factories remains cautious, which suggests manufacturers are leaning on existing capacity rather than gearing up for a full production surge. For trucking, that often translates into uneven freight: bursts of activity tied to restocking and backlog clearance rather than sustained, broad-based growth. Carriers should read the 52.6% PMI as an early warning, not a victory lap. If follow-on reports confirm that orders and production continue to firm through February and March, capacity discipline could finally start to matter again. Until then, the January PMI is best viewed as a signal that the floor may be forming under industrial freight, even if the ceiling still feels a long way off.
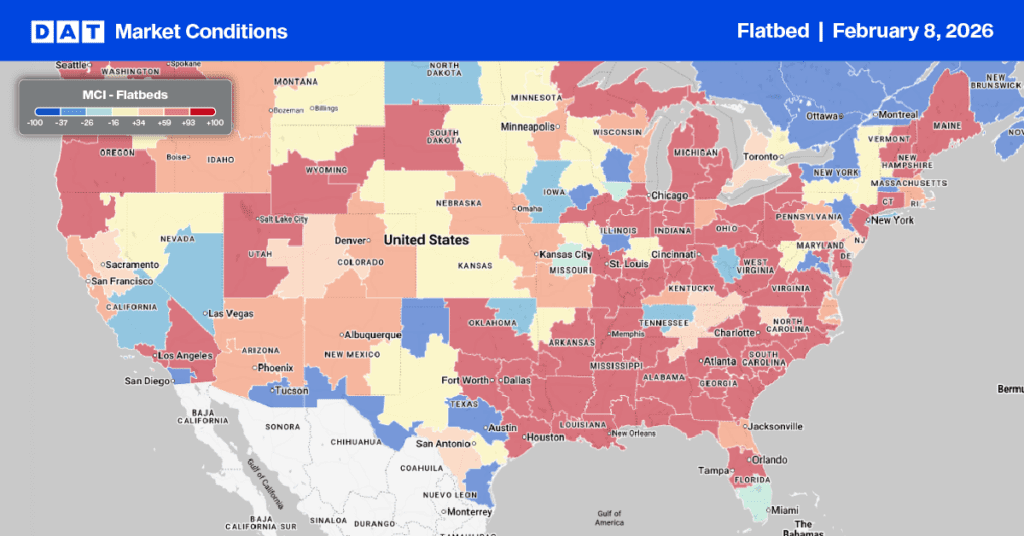
Flatbed Market Conditions
Flatbed load post volume experienced another significant rise last week, increasing nearly 10% as the month concluded. This surge boosted the load-to-truck ratio by 8%, reaching 50.89. Flatbed load post volumes are currently robust, standing almost 60% higher than the same period last year and 35% above the long-term average.
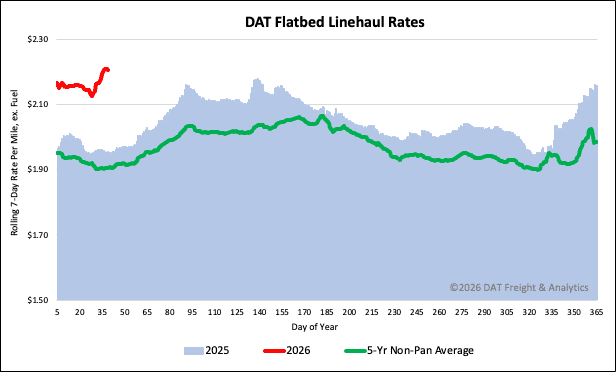
National flatbed spot rates
Following a $0.05 per mile increase last week, the national average spot rate for flatbed carriers is now just over $2.21 per mile. This current rate is notably higher than in previous years. Specifically, it is 13% ($0.25 per mile) above the rate for the same period last year. It is also $0.28 per mile higher than the 2018 level, and 14% ($0.30 per mile) higher than the 5-year average (excluding pandemic years).