All rates cited below exclude fuel surcharges, and load volume refers to loads moved unless otherwise noted. The rate charts exclude 2021 and 2022 years influenced by the pandemic. Data analysis for the week ending Saturday, April 25th, 2026.
The March Cass Freight Index offered an increasingly constructive read on the truckload market. The shipments component fell 4.5% year-over-year but gained 3.0% month-over-month, building on a 10.4% surge in February.  In seasonally adjusted terms, shipments rose 1.0% m/m, putting the index on track to turn positive year-over-year in the second half of 2026.  Demand isn’t the engine yet — but it’s starting to turn over. Supply constraints are doing most of the work on rates.
The Cass Truckload Linehaul Index sits 1.8% above year-ago levels, with capacity contracting and the market having recently re-entered a driver shortage.  The non-domiciled CDL rule that took effect mid-March is already registering: ACT’s For-Hire Driver Availability Index tightened to 35.0 in March from 39.8 in February — a level that has historically coincided with the start of the last two rate cycles.  For carriers and brokers tracking DAT spot rates, the Cass data confirms what the market is already feeling: this recovery is being earned through attrition, not demand growth. Shippers holding favorable contract rates should take note — the window is narrowing.
Get the clearest, most accurate view of the truckload marketplace with data from DAT iQ.
Tune into DAT iQ Live, live on YouTube or LinkedIn, 10am ET every Tuesday.
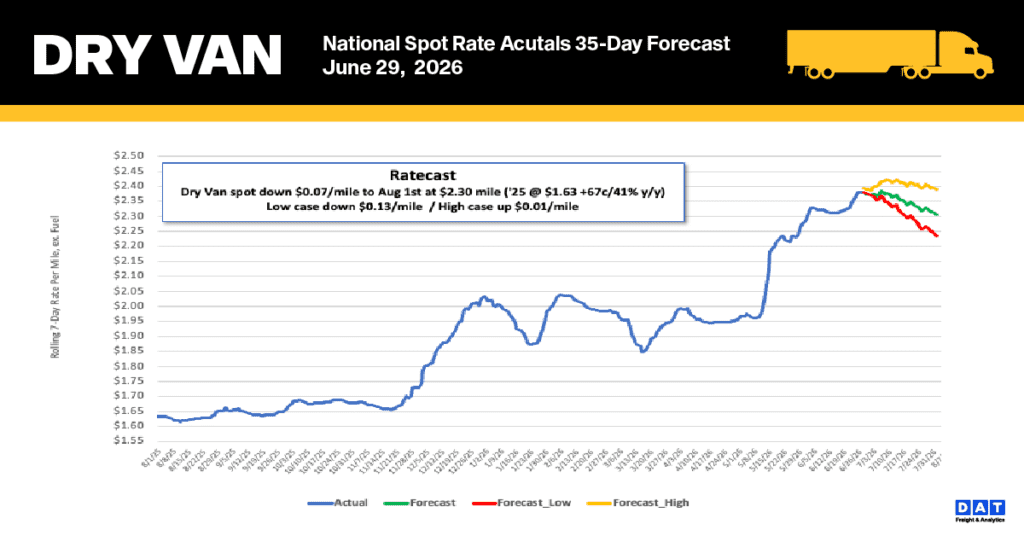
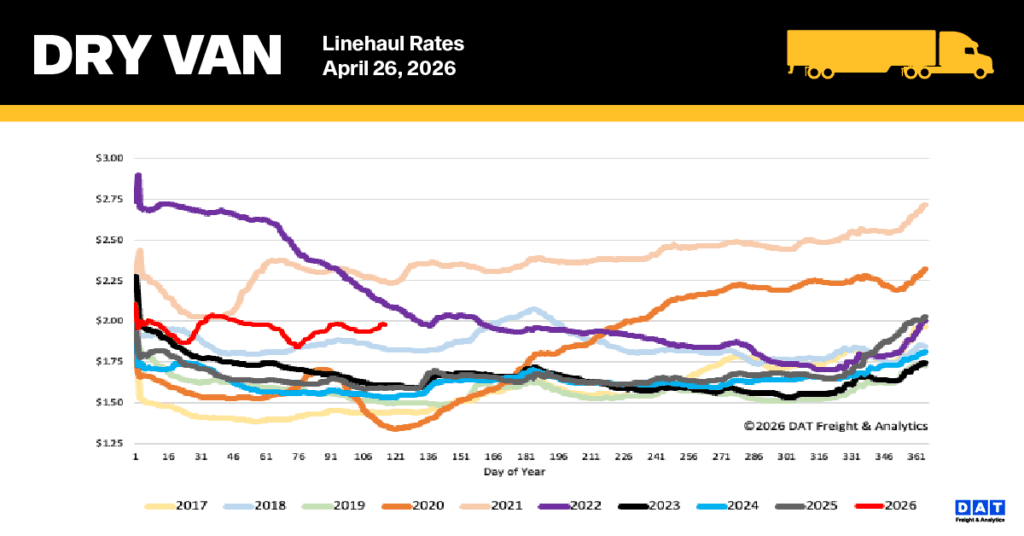
National dry van linehaul spot rates
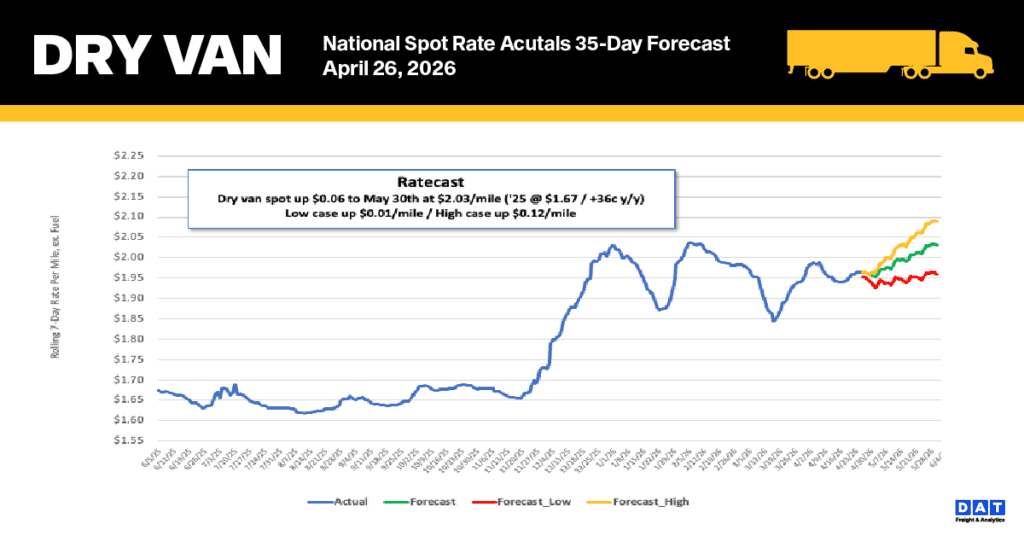
Last week, the national 7-day average dry van linehaul spot rate (excluding fuel) stabilized, holding steady just under $1.99 per mile. This rate is substantially higher than historical norms: it is $0.39, or 25%, above the rate recorded a year ago. Furthermore, at $0.46 (23%) higher, it exceeds the five-year average when excluding the pandemic-affected years.
Last week, spot rates on DAT’s top 50 lanes, based on load volume, dropped a penny per mile, settling the average at $2.35 per mile. This figure is $0.36 higher than the national 7-day rolling spot rate.
The Midwest, a critical region comprising 13 states, acts as a national bellwether and generates almost half of the country’s load volume. The average rate in this region decreased by $0.04 per mile to settle at $2.28 per mile. Despite this modest decline, the Midwest average remains robust and continues to outperform the national 7-day rolling average by $0.29, a trend consistently observed in the performance of its top lanes.
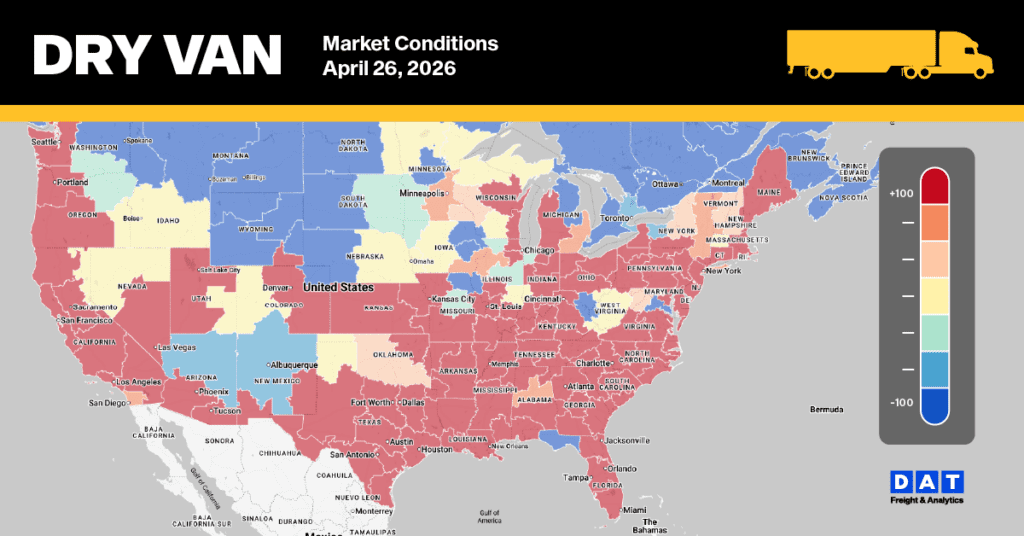
Dry Van Market Conditions
The dry van load-to-truck ratio held steady at 7.45 nationally, despite a 6% weekly drop in load post volumes. This continued stability was supported by a 10% decrease in equipment posts, which signals a continued tightening of truckload capacity. While load posts were down from the previous week, they remained exceptionally high, sitting 32% above last year’s figures and 78% above the long-term average for late April.