The Logistics Manager’s Index (LMI), produced by Zac Rogers at Colorado State University, came in at 58.2 in March 2024, up (+1.8) from January’s reading of 55.6; this is the fastest rate of expansion in the overall index since the reading of 61.2 from 18 months ago in September of 2022. Rogers said, “The change this month was primarily driven by a continued rebuilding of Inventory Levels (+5.3), at 63.8, which has been at its highest level since October 2022. This growth has had cascading effects on tightening Warehousing Capacity (-8.2), which has been back into contraction territory for the first time since January 2023. These changes suggest that firms are building up inventories in anticipation of continued consumer spending and suggest that the economy will continue to grow in the near term.”
Get the clearest, most accurate view of the truckload marketplace with data from DAT iQ.
Tune into DAT iQ Live, live on YouTube or LinkedIn, 10am ET every Tuesday.
The LMI read in at 58.3 in March, up (+1.8) from February’s reading of 56.5. The March LMI report noted, “This is the seventh time in the last eight months that the LMI has shown expansion. This growth is driven by the buildup of inventories, the subsequent tightening of warehousing, and the ongoing slow yet steady recovery in transportation. The broader optimism of our respondents is reflected in the University of Michigan’s Index of Consumer Sentiment, which is up (+3.3%) to 79.4 in March and is 28.1% higher than a year ago. Consumers are confident about the current state of the economy and that inflation will continue to slow down.”
The LMI score combines eight unique components of the logistics industry, including inventory levels and costs, warehousing capacity, utilization, and prices, as well as transportation capacity, utilization, and prices. The LMI is calculated using a diffusion index, in which any reading above 50.0 indicates that logistics is expanding; a reading below 50.0 indicates a shrinking logistics industry. The latest results of the LMI summarize the responses of supply chain professionals collected in February 2024.
Market watch
All rates cited below exclude fuel surcharges unless otherwise noted.
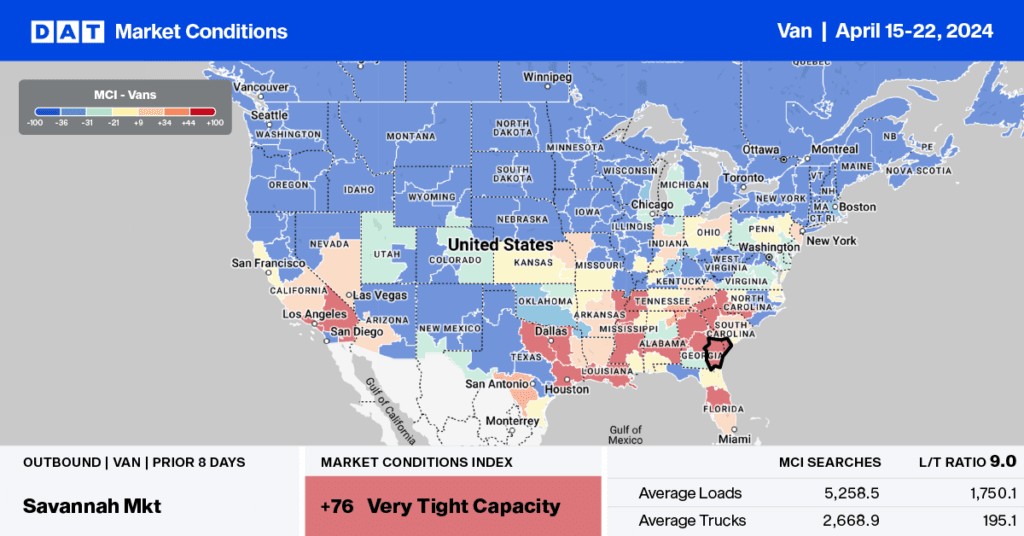
Average linehaul rates in DAT’s Top 5 spot market states (California, Texas, Illinois, Georgia, and New Jersey) were flat last week, averaging $1.70/mile, identical to last year. Benefiting from the surge in Asian imports, the Los Angeles dry van market saw a 4% higher volume of loads moved last week, 7.3% higher y/y. Despite the higher demand, linehaul rates remained unchanged at $1.65/mile for outbound loads.
On the long-haul 2,000-mile haul east to Chicago, where truckload carriers compete with intermodal carriers, truckers were paid an average of $1.50/mile, $0.33/mile higher than last year and $0.23/mile higher than last month on a 47% higher month-over-month volume of loads moved. Since the end of 2021, when demand for imported goods peaked during the pandemic, the volume of loads moved on this lane has halved, and linehaul rates have dropped by 57% or almost $2.00/mile.
Load-to-Truck Ratio
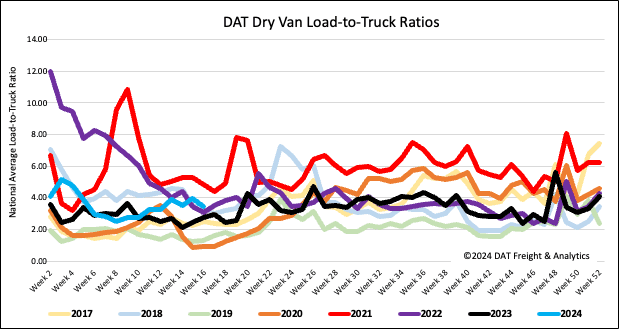
Dry van load post volume lost ground following last week’s 11% w/w slide, almost the exact week-over-week change as last year. Equipment posts reversed course, increasing by 7% w/w, resulting in the dry van load-to-truck ratio decreasing by 13% w/w to 3.44.
Linehaul spot rates
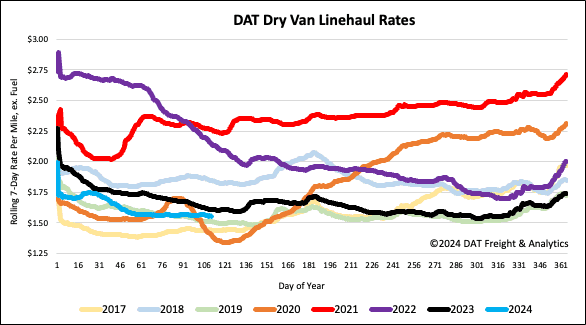
The national average dry van linehaul rate decreased by almost a penny per mile for the second week to just over $1.56/mile last week. Compared to last year, linehaul rates are $0.05/mile lower and just $0.04/mile higher than 2019.
