The April Logistics Manager’s Index (LMI) recorded a slight increase to 58.8, indicating expansion in the logistics industry, influenced by rising costs and changes in inventory dynamics. Key highlights include:
- Inventory dynamics: Inventory levels increased, but the rate of growth slowed. Additionally, inventory costs rose significantly, suggesting stagnant stockpiles.
- Rising costs: Warehousing prices surged due to high inventory levels, contributing to an overall increase in logistics costs.
- Transportation trends: Transportation prices and utilization saw growth, largely driven by downstream activities, despite some contraction in upstream activities.
- Economic impact: Higher inventory levels in the first quarter, driven by tariff concerns, contributed to a 0.3% decline in the U.S. GDP. Consumer sentiment also experienced significant declines due to economic uncertainties.
- Global and future predictions: Tariffs significantly impacted global trade dynamics, with exports from China and the EU to the U.S. affecting their economic growth. Future predictions suggest continued expansion in the logistics sector, though this will be accompanied by high costs and cautious inventory management.
Get the clearest, most accurate view of the truckload marketplace with data from DAT iQ.
Tune into DAT iQ Live, live on YouTube or LinkedIn, 10am ET every Tuesday.
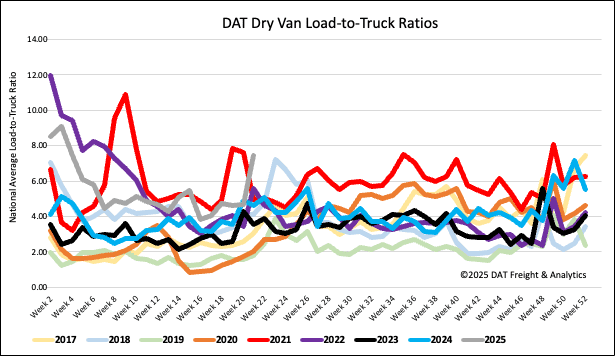
Load-to-Truck Ratio
Dry van load post volumes were the highest in four years as last week’s Roadcheck Week-driven capacity crunch drove volumes 42% w/w and 10% y/y higher. As they do every year, carriers took time off during last week’s CVSA safety blitz, with an 11% drop in weekly equipment posts compared to the week prior. The long-term average decrease in equipment posts due to Roadcheck Week is 8% for dry vans. As a result, last week’s dry van load-to-truck ratio (LTR) was up 60% to 7.43, the second-highest in nine years for Week 20 (surpassed only by 2021 at 7.60).
Linehaul spot rates
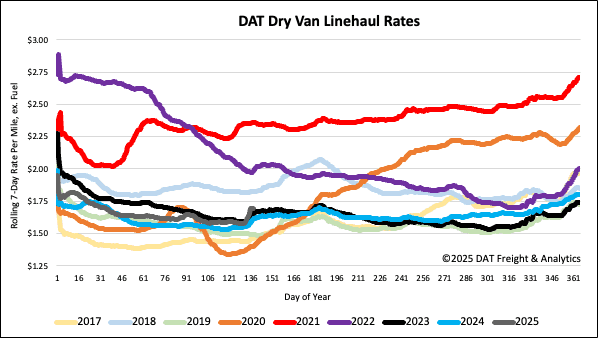
Dry van linehaul rates were the highest in three years as last week’s CVSA safety blitz resulted in a dry van capacity crunch. Spot rates jumped by $0.10/mile w/w to a national 7-day rolling average of $1.70/mile, now $0.08/mile higher than last year.
On DAT’s Top 50 lanes, ranked by the volume of loads moved, carriers were paid an average of $1.96/mile, up $0.07/mile and $0.26/mile higher than the national 7-day rolling average spot rate.
In our Midwest Region bellwether states (n=13), which account for 45% of loads moved nationally last week and have the highest correlation to the national average, outbound spot rates were up $0.13/mile on a 2% lower volume of outbound loads moved. Carriers were paid an average of $1.85/mile, $0.15/mile higher than the national 7-day rolling average.