New Jersey, representing around 2% of weekly spot market truckload volume, provides a critical link in the national freight network and provides direct access to the major freight markets on the East Coast and Midwest. Truckload carriers can quickly move freight on major U.S. highways, including I-87, I-95, I-84, I-78, I-80, I-280, and I-278. The State is within a day’s drive of 30% of the U.S. population and a 500-mile radius of the Port Authority of New York and New Jersey (PANYNJ) waterfront are major Canadian metropolitan areas, including Montreal, Ottawa, and Toronto.
Get the clearest, most accurate view of the truckload marketplace with data from DAT iQ.
Tune into DAT iQ Live, live on YouTube or LinkedIn, 10am ET every Tuesday.
Within 50 miles of the PANYNJ is approximately one billion square feet of warehousing and distribution space, transforming Elizabeth, N.J., into a significant outbound freight market. On the import front, PANYNJ is the number two port for U.S. imports, although it did enjoy the number one for a few months in 2022 as shippers diverted discretionary freight away from the congested West Coast.
The top five lanes for spot market loads are Boston, Charlotte, Chicago, Columbus, and Joliet, with outbound truckload volumes tied closely to containerized import volume at the PANYNJ. According to IHS Markit/PIERS, December imports were up 7.6% year-over-year (y/y) following the 12.5% increase over November’s volume.
Market watch
All rates cited below exclude fuel surcharges unless otherwise noted.
Dry van spot market rates decreased by $0.02/mile in New Jersey last week, averaging $1.47/mile. Despite this, the outbound volume of truckloads moving is 6% higher than last year. Top lanes include Columbus, OH, where spot rates were the highest in 12 months at $1.46/mile, while on the number two lane south to Charlotte, NC, spot rates were also the highest in 12 months at $1.67/mile.
In other Top 5 spot markets, spot rates decreased by $0.03/mile in Los Angeles even though the volume of loads moved was 3% higher last week than last year. In Atlanta, rates increased by a penny per mile for the fourth week on the same volume of loads moved as last year. Loads from Atlanta to Orlando paid carriers $2.66/mile, the highest in 12 months; the volume of loads moved on this lane is 15% higher than last year.
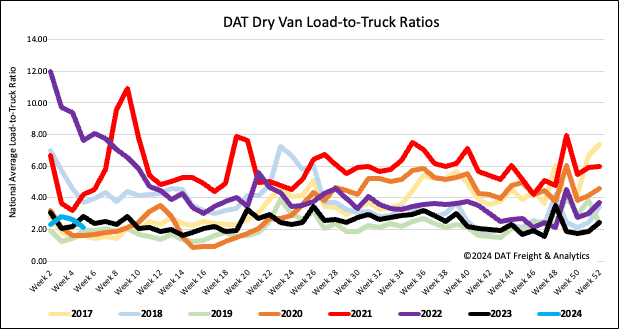
Load-to-Truck Ratio (LTR)
National spot market load post (LP) volumes decreased last week to levels last seen in 2019 and early 2020, the lowest in eight years, with the exception of 2017. LP volumes dropped 20% w/w, while carrier equipment posts (EP) were mostly flat, resulting in last week’s dry van load-to-truck ratio (LTR) decreasing by 18% to 2.14.
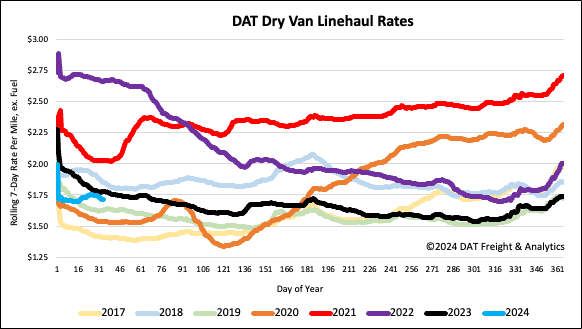
Linehaul Spot Rates
The gains of the prior two weeks following the extreme cold weather were erased following last week’s $0.02/mile decrease in the national average dry van linehaul rate. At $1.72/mile, linehaul rates are $0.06/mile lower than last year. Based on the volume of loads moved DAT’s Top 50 lanes averaged $1.99/mile last week, $0.25/mile higher than the national average.