Reefer carriers still feel the aftershocks of September’s Hurricane Ian, the deadliest storm to hit Florida since 1935. Heavy rainfall, flooding, and infrastructure wind damage have delayed the start of the Florida produce season. According to the USDA, weekly truckload volumes of fruit and vegetables are currently 35% lower than at the beginning of December last year, when produce volumes started to ramp up. Nationally, the official hurricane season, which runs from June 1 to November 30, ended on average with 14 named storms, eight hurricanes (average is 7), and two major hurricanes (average is 3).
It was anything but average in terms of damage, though. The 2022 hurricane season ended up being third-most expensive to date, with losses estimated at $110 billion, according to reinsurer Munich Re. Hurricane Ian alone is expected to generate losses of $100 billion. Ernst Rauch, Chief Climate Scientist at Munich Re, said, “2022 continues the trend of increasing losses from U.S. hurricanes in recent years. A single storm like Ian’s is enough to cause immense losses. This is not new, of course, but it is important. Because it is precisely hurricanes like Ian – powerful storms with extreme precipitation – that will occur more frequently in the future due to climate change.”
The 2022 season resulted in some firsts, also. It was the first August when the U.S. didn’t have any named storms from July 3 to August 31, the first time since 1941. Then in September, the hurricane seemed to turn off after Ian made landfall, but then Hurricane Nicole, followed by Fiona, appeared on the horizon. Nicole was the first hurricane to strike anywhere in the U.S. in November in nearly 40 years.
Market Watch
All rates cited below exclude fuel surcharges unless otherwise noted.
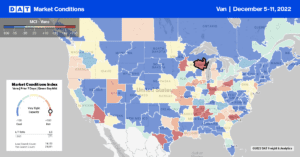
As manufacturers imported to derisk their supply chains away from China and look closer to home, near-shoring to countries like Mexico has resulted in higher truckload volumes in recent years. Looking at loads moved by truckload carriers out of southern border markets, volumes have increased approximately 25-30% y/y consecutively since 2016. They have slowed in the second half of this year, though. Dry van linehaul rates along the southern border increased by $0.03/mile to an average outbound rate of $1.79/mile, making it fourteen weeks of gains. Last week’s average is almost identical to 2018 levels.
On the West Coast in Los Angeles and Ontario, linehaul rates increased $0.04/mile w/w to an average of $1.84/mile, reversing the losses of the prior two weeks. Loads moved from Los Angeles to Chicago were up another 14% w/w with spot rates elevated at $1.58/mile, up $0.20/mile compared to the November average. Loads to Phoenix dropped to their lowest level in 12 months at $2.74/mile. Capacity in the Pacific Northwest tightened for the fourth week in a row — rates increased by $0.07/mile last week to $1.57/mile for outbound loads tracking very closely with 2017 and 2018 levels. Pendleton, OR, loads to Los Angeles were up to $1.26/mile last week, which is around $0.80/mile lower y/y.
In West Virginia last week, truckload capacity was tight following a $0.23/mile w/w increase to a state average of $2.51/mile. In Huntington, WV, linehaul rates increased by $0.14/mile to $2.14/mile, and on the 330-mile haul to Chicago, rates $2.81/mile are $0.22/mile higher than the November average and more than $1.00/mile lower than the previous year.
Load-to-Truck Ratio (LTR)
Load posts dropped back slightly under one million weekly load posts following the post-Thanksgiving surge created by the threat of a rail strike the week prior. Volumes were down 29% w/w and, compared to previous years, are 42% lower than in 2021 but 18% higher than in 2019. Carrier equipment posts remained at the highest level in six years and around 21% higher than in 2019. As a result, last week’s dry van load-to-truck ratio (LTR) decreased from 4.49 to 2.78, which is within 5% of 2019 LTRs.
Linehaul Spot Rates
The national average dry van rate was flat last week at $1.80/mile after decreasing by 35% since the start of the year. Compared to prior years, last week’s national average is $0.76/mile lower than 2021 but still $0.03/mile higher than the 2017/2018 levels. The national average linehaul rate of $1.80/mile is $0.30/mile, still lower than the top 50 dry van lanes based on the volume of loads moved, which averaged $2.10/mile last week, the same as the week prior.


