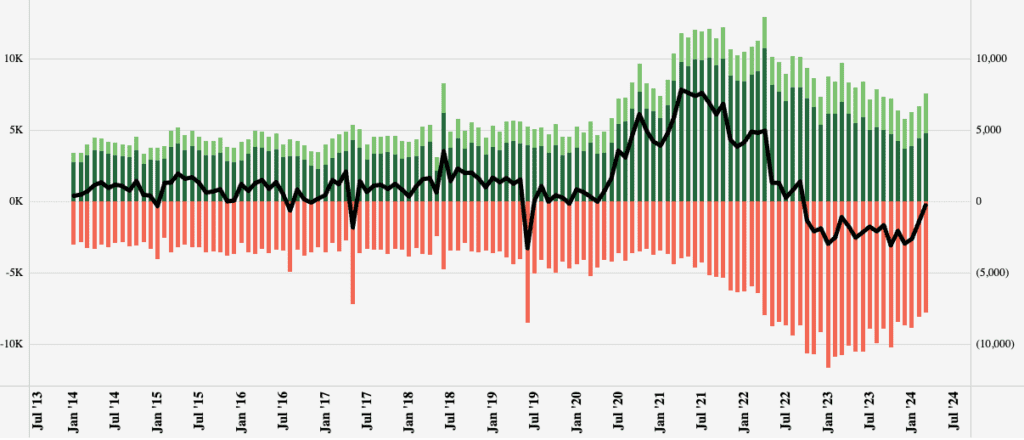
Based on the operating status data supplied by the Federal Motor Carrier Safety Administration (FMCSA), the rate of interstate carrier exits slowed considerably in the first quarter. Surprisingly, the number of new entrants increased over the same timeframe—eight joined for every ten carriers that exited the industry last quarter. The number of carrier exits dropped 12% in Q1, while new and reactivated carriers rose by 20%. It seems that some see no path forward, while others see opportunity.
Get the clearest, most accurate view of the truckload marketplace with data from DAT iQ.
Tune into DAT iQ Live, live on YouTube or LinkedIn, 10am ET every Tuesday.
The most likely explanation, confirmed by discussions with independent contractors, is that interstate carriers electing to exit the industry could no longer bear the burden of higher operating costs, mainly finance, and insurance, while new entrants are coming in at a lower cost base as used truck prices continue to fall.
New carrier monthly authority activation rates (see dark green in Fig 1) increased 24% in Q1 but remain 31% lower than last year. Reactivation monthly rates (light green) increased by 14% in Q1 and 1% y/y. Over the last year, the long-haul sector lost 122,000 carriers but gained 96,000. The net result of capacity movement in the long-haul sector is that the number of new and reactivated authorities almost equaled deactivations for the first time since October 2022. The exodus of carriers in the spot market following the massive influx during the pandemic is almost over as the market returns to equilibrium.
Market watch
All rates cited below exclude fuel surcharges unless otherwise noted.
Available capacity tightened in Seattle following last week’s 8% increase in outbound linehaul rates on a 10% lower volume of loads moved. At $1.46/mile, linehaul rates are $0.09/mile higher than last year, driven by solid gains on the regional lane east to Spokane – last week, spot rates were up $0.04/mile to $2.68/mile on a 2% higher volume of loads moved. In Contrast, longer haul loads to Los Angeles paid carriers an average of $0.70/mile, up $0.04/mile w/w and slightly higher than the cost of diesel for the 1,100-mile haul.
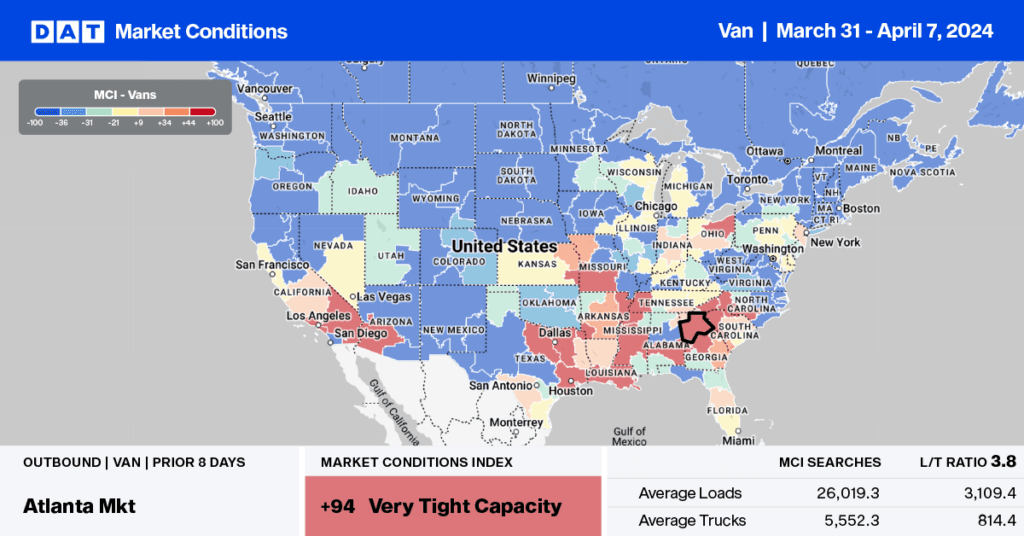
In four of the Top 5 spot markets, rates were up on lower volumes last week, another indicator that spot market capacity exits is resulting in a rebalancing in the market. In California, outbound Los Angeles loads were up $0.04/mile to $1.99/mile on an 8% lower volume, while in Dallas, volumes dropped 9% w/w with spot rates increasing by $0.02/mile to $1.46/mile. In Chicago, a similar trend emerged where volumes were down 13% w/w, with spot rates up $0.01/mile to $1.94/mile. The volume of loads moved in Atlanta decreased 6% w/w, while spot rates increased by $0.02/mile to $1.68/mile. In Elizabeth, NJ, rates were flat at $1.39/mile on a 13% lower volume of loads moved.
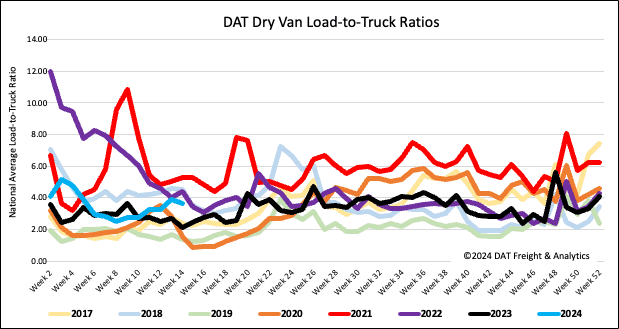
Load-to-Truck Ratio
Following the month-end increase in shipping volumes, dry van load post volume dropped back last week, decreasing by 11% week-over-week (w/w) but remaining 14% higher year-over-year (y/y). Ongoing interstate carrier exits from the industry result in decreased available capacity following last week’s 5% drop in equipment posts, decreasing the load-to-truck ratio by 6% to 3.64.
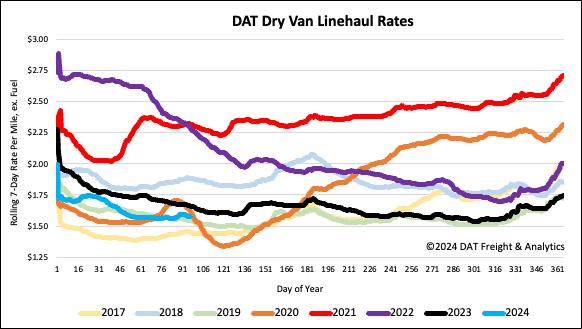
Spot rates
At $1.58/mile, the national average dry van linehaul rate has remained mostly flat for the last seven weeks. Compared to last year, linehaul rates are $0.08/mile lower and just $0.02/mile higher than 2019.